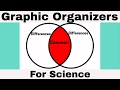
Graphic Organizers in Science
Interactive Video
•
Science
•
5th - 8th Grade
•
Practice Problem
•
Medium

Ethan Morris
Used 3+ times
FREE Resource
Read more
10 questions
Show all answers
1.
MULTIPLE CHOICE QUESTION
30 sec • 1 pt
What is the primary purpose of a concept map?
To depict a continuous cycle
To show a sequence of events
To organize information on broad topics
To compare two concepts
2.
MULTIPLE CHOICE QUESTION
30 sec • 1 pt
In a concept map, where is the most general concept placed?
At the top
On the left side
In the center
At the bottom
3.
MULTIPLE CHOICE QUESTION
30 sec • 1 pt
What do the overlapping areas in a Venn diagram represent?
Unique characteristics
Common characteristics
Sequential events
Unrelated concepts
4.
MULTIPLE CHOICE QUESTION
30 sec • 1 pt
How many circles are typically used in a Venn diagram?
Three only
Two or more
Four only
One
5.
MULTIPLE CHOICE QUESTION
30 sec • 1 pt
What is the main function of a flowchart?
To show the order of events
To organize broad topics
To depict a continuous cycle
To compare different ideas
6.
MULTIPLE CHOICE QUESTION
30 sec • 1 pt
In a flowchart, what type of questions can be used to decide the next step?
Multiple choice questions
Yes and no questions
Open-ended questions
True or false questions
7.
MULTIPLE CHOICE QUESTION
30 sec • 1 pt
What type of sequence does a cycle diagram represent?
Hierarchical sequence
Continuous or cyclical sequence
Random sequence
Linear sequence
Access all questions and much more by creating a free account
Create resources
Host any resource
Get auto-graded reports
Continue with Google

Continue with Email
Continue with Classlink
Continue with Clever
or continue with
Microsoft
%20(1).png)
Apple
Others
Already have an account?
