Graphing Equations and Writing Equations
Authored by Anthony Clark
Mathematics
8th Grade
CCSS covered

AI Actions
Add similar questions
Adjust reading levels
Convert to real-world scenario
Translate activity
More...
Content View
Student View
13 questions
Show all answers
1.
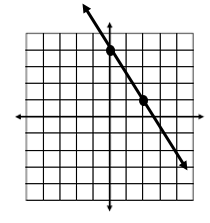
MULTIPLE CHOICE QUESTION
1 min • 1 pt
2.
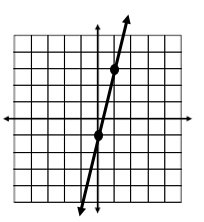
MULTIPLE CHOICE QUESTION
1 min • 1 pt

Which equation matches the description if x is the number of minutes and y is the total cost.
y = 1.20
y= 1.20x
x = 1.20
x = 1.20y
Tags
CCSS.6.EE.C.9
3.
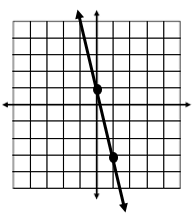
MULTIPLE CHOICE QUESTION
1 min • 1 pt

The graph shows the total money earned at a fundraising car wash. Which equation can be used to find the total earned y for the number of cars washed x?
y = x + 5
y = x/5
y = x - 5
y = 5x
Tags
CCSS.8.F.B.4
CCSS.HSF.LE.A.2
4.
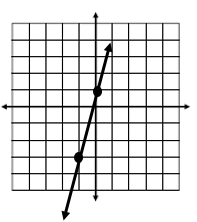
MULTIPLE CHOICE QUESTION
1 min • 1 pt

Which equation matches the table?
y = 5x
y = 5x + 1
y = x + 5
y = x + 1
Tags
CCSS.8.F.B.4
CCSS.HSF.LE.A.2
5.
MULTIPLE CHOICE QUESTION
1 min • 1 pt
Gourmet chocolate costs $5.25 per pound. Which equation best represents y, the total cost of x pounds of chocolate?
x = 5.25y
y = 5.25 + x
y = 5.25x
x = 5.25 +y
Tags
CCSS.6.EE.C.9
6.
MULTIPLE CHOICE QUESTION
1 min • 1 pt

The table shows the ounces of water,y, need to for x number of servings.
Based on the information in the table, which equation can be used to model the relationship between x and y?
y = 2x
y = x + 2
y = 18x
y = x + 18
Tags
CCSS.6.EE.C.9
7.
MULTIPLE CHOICE QUESTION
1 min • 1 pt

The graph shows the amounts of money raised for scholarships over a four month period.
Based on the graph, what is the constant rate of earnings for scholarships? (How much was raised per month?)
$500 per month
$1,000 per month
$2,000 per month
$4,000 per month
Tags
CCSS.HSF.IF.B.4


Access all questions and much more by creating a free account
Create resources
Host any resource
Get auto-graded reports
Continue with Google

Continue with Email
Continue with Classlink
Continue with Clever
or continue with
Microsoft
%20(1).png)
Apple
Others
Already have an account?
Similar Resources on Wayground

10 questions
Հանրահաշիվ 8; Գծ. հավ. համակարգեր:
Quiz
•
8th Grade
14 questions
Alg. CH 5 Terms
Quiz
•
9th Grade
10 questions
operaciones entre funciones
Quiz
•
10th Grade
12 questions
Solve 2-step equations with integers
Quiz
•
7th - 8th Grade
10 questions
19 NMMS અંગ્રેજી મૂળાક્ષર શ્રેણી
Quiz
•
8th Grade
10 questions
Derivadas básicas
Quiz
•
11th - 12th Grade
12 questions
Latihan soal Matematika IPS
Quiz
•
University
12 questions
Parabola1
Quiz
•
10th Grade
Popular Resources on Wayground
15 questions
Fractions on a Number Line
Quiz
•
3rd Grade
10 questions
Probability Practice
Quiz
•
4th Grade
15 questions
Probability on Number LIne
Quiz
•
4th Grade
20 questions
Equivalent Fractions
Quiz
•
3rd Grade
25 questions
Multiplication Facts
Quiz
•
5th Grade
22 questions
fractions
Quiz
•
3rd Grade
6 questions
Appropriate Chromebook Usage
Lesson
•
7th Grade
10 questions
Greek Bases tele and phon
Quiz
•
6th - 8th Grade
Discover more resources for Mathematics
15 questions
Graphing Inequalities
Quiz
•
7th - 9th Grade
20 questions
Graphing Inequalities on a Number Line
Quiz
•
6th - 9th Grade
8 questions
8th U5L20 Volume of Sphere
Quiz
•
8th Grade
20 questions
Solving Systems of Equations Review
Quiz
•
8th Grade
20 questions
Slope from a Graph
Quiz
•
8th Grade
15 questions
Combine Like Terms and Distributive Property
Quiz
•
8th - 9th Grade
10 questions
Plotting Points on a Coordinate Plane: Quadrant 1 Essentials
Interactive video
•
6th - 10th Grade
20 questions
Scatter Plots and Line of Best Fit
Quiz
•
8th Grade