
Interpreting Function Graphs
Authored by Anthony Clark
Mathematics
9th Grade


AI Actions
Add similar questions
Adjust reading levels
Convert to real-world scenario
Translate activity
More...
Content View
Student View
10 questions
Show all answers
1.
MULTIPLE CHOICE QUESTION
1 min • 1 pt
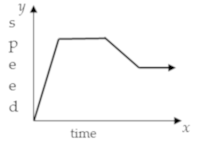
List the types of intervals that the graph demonstrates in order.
decreasing, constant, increasing, constant
increasing, decreasing, constant
increasing, constant, increasing, constant
increasing, constant, decreasing, constant
2.
MULTIPLE CHOICE QUESTION
1 min • 1 pt

When is this function increasing?
−2.5 < x < 2.5
0 < x < 5
0 < x < 55
−5 < x < 0
3.
MULTIPLE CHOICE QUESTION
1 min • 1 pt

What is the equation for axis of symmetry?
y=3
x=3
x=5
x=1
4.
MULTIPLE SELECT QUESTION
1 min • 1 pt

Check all that apply to the following graph:
Discrete
Continuous
Linear
Not a function
Function
5.
MULTIPLE CHOICE QUESTION
1 min • 1 pt

Which of the following represents the range of the graph?
6.
MULTIPLE CHOICE QUESTION
1 min • 1 pt
Which of the following represents the x intercept of the function?
y = -4.5
(0,-4)
(3,0)
y = 8
7.
MULTIPLE SELECT QUESTION
1 min • 1 pt

Select all that apply to label (a)
absolute maximum
absolute minimum
relative maximum
relative minimum
endpoint
Access all questions and much more by creating a free account
Create resources
Host any resource
Get auto-graded reports

Continue with Google

Continue with Email

Continue with Microsoft
or continue with

%20(1).png)
Apple

Others
By signing up, you agree to our Terms of Service & Privacy Policy
Already have an account?


