Ratios and Ratio Graphs
Authored by Anthony Clark
Mathematics
6th Grade
CCSS covered

AI Actions
Add similar questions
Adjust reading levels
Convert to real-world scenario
Translate activity
More...
Content View
Student View
15 questions
Show all answers
1.
MULTIPLE CHOICE QUESTION
1 min • 1 pt

What is C?
80
24
96
92
Tags
CCSS.5.OA.B.3
2.
MULTIPLE CHOICE QUESTION
1 min • 1 pt

The 6th grade took a field trip to the movies. The table shows the price of popcorn based on the quantity purchased. How much would it cost for 20 bags of popcorn?
50
55
60
65
Tags
CCSS.5.OA.B.3
3.
MULTIPLE CHOICE QUESTION
1 min • 1 pt

The relationship between the number of hours traveled and the number of miles traveled on a family road trip is graphed here. What is the ratio of hours to miles in lowest terms?
9 : 675
75 : 1
3 : 225
1 : 75
4.
MULTIPLE CHOICE QUESTION
1 min • 1 pt
What is the ratio of the line graph shown?
4:1
2:1
3:2
8:1
5.
MULTIPLE CHOICE QUESTION
1 min • 1 pt

What is the constant of proportionality in the graph?
46
92
184
41
Tags
CCSS.7.RP.A.2D
6.
MULTIPLE CHOICE QUESTION
1 min • 1 pt

What is the constant of proportionality of the graph above?
0
1/6
60
10
Tags
CCSS.7.RP.A.2B
7.
MULTIPLE CHOICE QUESTION
1 min • 1 pt

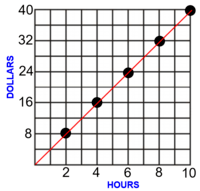
Which of the following statements can be used to create the graph shown?
For every 5 hours of work you get $6
For every 24 hours of work you get $10
For every 36 hours of work you get $50
For every 6 hours of work you get $5
Tags
CCSS.7.RP.A.2D


Access all questions and much more by creating a free account
Create resources
Host any resource
Get auto-graded reports
Continue with Google

Continue with Email
Continue with Classlink
Continue with Clever
or continue with
Microsoft
%20(1).png)
Apple
Others
Already have an account?
Similar Resources on Wayground

15 questions
Quiz on module-03
Quiz
•
University
20 questions
Real Life Graphs
Quiz
•
8th Grade
10 questions
Sports Math
Quiz
•
7th - 8th Grade
10 questions
Class VII
Quiz
•
7th Grade
10 questions
Rational Exponents and Complex Numbers
Quiz
•
8th Grade
12 questions
F1 - Discount
Quiz
•
7th Grade
10 questions
Find derivative and gradient of a tangent
Quiz
•
12th Grade
20 questions
G12_Math+for+Bus+Eco_Term+Exam_Mock+Test
Quiz
•
12th Grade
Popular Resources on Wayground
7 questions
History of Valentine's Day
Interactive video
•
4th Grade
15 questions
Fractions on a Number Line
Quiz
•
3rd Grade
20 questions
Equivalent Fractions
Quiz
•
3rd Grade
25 questions
Multiplication Facts
Quiz
•
5th Grade
22 questions
fractions
Quiz
•
3rd Grade
15 questions
Valentine's Day Trivia
Quiz
•
3rd Grade
20 questions
Main Idea and Details
Quiz
•
5th Grade
20 questions
Context Clues
Quiz
•
6th Grade
Discover more resources for Mathematics
20 questions
Writing Algebraic Expressions
Quiz
•
6th Grade
20 questions
Ratios/Rates and Unit Rates
Quiz
•
6th Grade
20 questions
Graphing Inequalities on a Number Line
Quiz
•
6th - 9th Grade
20 questions
One Step Equations
Quiz
•
6th Grade
10 questions
Solving One Step Inequalities
Quiz
•
6th Grade
15 questions
Equivalent Ratios
Quiz
•
6th Grade
16 questions
2022 Winter Olympics Medal Table
Passage
•
6th - 8th Grade
20 questions
Writing Ratios & Identifying Equivalent Ratios
Quiz
•
6th Grade