
Graphing Ratio Table
6th Grade
•16 Qs

Similar activities
रांझणी जी एस 8 सप्टेंबर 2020
1st - 8th Grade
•20 Qs
Measurements Review: Sy21-22
4th - 8th Grade
•21 Qs
Angle relationship
6th - 8th Grade
•13 Qs
Choosing suitable units
6th Grade
•12 Qs
Basic Calculations
4th - 9th Grade
•11 Qs
volume of triangular prism
6th - 7th Grade
•12 Qs
Review 11/18
6th - 7th Grade
•15 Qs
mantal math
6th Grade
•20 Qs

Graphing Ratio Table
Quiz
•
Mathematics
•
6th Grade
•
Practice Problem
•
Hard
+4
Standards-aligned

Anthony Clark
FREE Resource
Enhance your content in a minute
16 questions
Show all answers
1.
HOTSPOT QUESTION
1 min • 1 pt
Ross is buying hats for his baseball team. Each package contains 4 hats. Generate the set of ordered pairs for the ratio relationship between the number of hats y and the number of packages x for a total of 1, 2, 3, and 4 packages.
Select the points on the coordinate plane that correctly graph this ratio relationship.
Tags
graphing
2.
MULTIPLE CHOICE QUESTION
1 min • 1 pt

A car wash can wash four cars in one hour. The table shows the total number of cars washed in 0, 1, 2, and 3 hours.
Which graph represents the ordered pairs and describes the graph.


Tags
CCSS.5.OA.B.3
3.
MULTIPLE CHOICE QUESTION
1 min • 1 pt

Erasers cost 5 cents each at the school store. The table shows this relationship. Choose the graph which displays the ordered pairs and describes the graph.


Tags
CCSS.7.RP.A.2D
4.
MULTIPLE CHOICE QUESTION
1 min • 1 pt
What is the ratio of the line graph shown?
4:1
2:1
3:2
8:1
Tags
CCSS.7.RP.A.2C
5.
MULTIPLE CHOICE QUESTION
1 min • 1 pt

Which rate of change represents the graph shown?
4 place settings in each box
0.24 place setting in each box
2 place setting in each box
0.5 place setting in each box
Tags
CCSS.8.F.B.4
CCSS.HSF.IF.B.6
6.
MULTIPLE CHOICE QUESTION
1 min • 1 pt

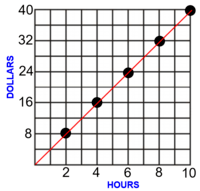
Which of the following statements can be used to create the graph shown?
For every 5 hours of work you get $6
For every 24 hours of work you get $10
For every 36 hours of work you get $50
For every 6 hours of work you get $5
Tags
CCSS.7.RP.A.2D
7.
MULTIPLE CHOICE QUESTION
1 min • 1 pt

Using the graph given, how much money would be given at 6 hours?
$12
$8
$16
$4
Tags
CCSS.HSF.IF.B.4


Access all questions and much more by creating a free account
Create resources
Host any resource
Get auto-graded reports
Continue with Google

Continue with Email
Continue with Classlink
Continue with Clever
or continue with
Microsoft
%20(1).png)
Apple
Others
Already have an account?
Similar Resources on Wayground
15 questions
Choose the Measurement
Quiz
•
4th - 6th Grade
15 questions
Absolute Value and Integers
Quiz
•
6th - 7th Grade
20 questions
Y6_Week1_Spring_2022
Quiz
•
6th Grade
16 questions
Week 6 Review Quiz
Quiz
•
6th Grade
16 questions
Math 6 - Ratios Review
Quiz
•
6th Grade
15 questions
ÖMER HAYYAM
Quiz
•
5th - 8th Grade
20 questions
Math Pro
Quiz
•
4th - 6th Grade
11 questions
Prior Knowledge Check
Quiz
•
6th Grade
Popular Resources on Wayground
15 questions
Fractions on a Number Line
Quiz
•
3rd Grade
20 questions
Equivalent Fractions
Quiz
•
3rd Grade
25 questions
Multiplication Facts
Quiz
•
5th Grade
54 questions
Analyzing Line Graphs & Tables
Quiz
•
4th Grade
22 questions
fractions
Quiz
•
3rd Grade
20 questions
Main Idea and Details
Quiz
•
5th Grade
20 questions
Context Clues
Quiz
•
6th Grade
15 questions
Equivalent Fractions
Quiz
•
4th Grade
Discover more resources for Mathematics
15 questions
Distributive Property & Review
Quiz
•
6th Grade
20 questions
Writing Algebraic Expressions
Quiz
•
6th Grade
20 questions
Ratios/Rates and Unit Rates
Quiz
•
6th Grade
20 questions
Graphing Inequalities on a Number Line
Quiz
•
6th - 9th Grade
20 questions
One Step Equations
Quiz
•
6th Grade
10 questions
Solving One Step Inequalities
Quiz
•
6th Grade
20 questions
graphing inequalities
Quiz
•
6th - 7th Grade
15 questions
One- Step Equations
Quiz
•
6th Grade