
Solving Inequalities Quadratics by Graphing
11th Grade
•13 Qs

Similar activities
Geometrija prostora i poliedri - zadatci s DM
10th - 12th Grade
•8 Qs
Equacoes do 2 grau
11th Grade
•18 Qs
Ayo Mengingat Kembali
KG - University
•10 Qs
Bilangan Bulat
11th Grade
•10 Qs
latihan turunan fungsi
11th Grade
•10 Qs
LOGARITHMS
9th - 12th Grade
•12 Qs
SUMA DE ÁNGULOS DE TRIÁNGULOS
6th - 12th Grade
•10 Qs
PENILAIAN HARIAN BARISAN DAN DERET
10th Grade - University
•10 Qs

Solving Inequalities Quadratics by Graphing
Quiz
•
Mathematics
•
11th Grade
•
Practice Problem
•
Hard
Standards-aligned

Anthony Clark
FREE Resource
Enhance your content in a minute
13 questions
Show all answers
1.
MULTIPLE CHOICE QUESTION
1 min • 1 pt

How many zeros does this parabola have?
3
2
0
1
Tags
CCSS.HSF-IF.C.7A
2.
MULTIPLE CHOICE QUESTION
1 min • 1 pt

3.
MULTIPLE CHOICE QUESTION
1 min • 1 pt

Q1. What are the roots of the equation x^2 - 6x + 8 = 0?
A) 4 and 2
B) -4 and -2
C) 4 and -2
D) -4 and 2
4.
MULTIPLE CHOICE QUESTION
1 min • 1 pt

How many solutions does this function have?
two
one
all real numbers
no real solutions
5.
MULTIPLE CHOICE QUESTION
1 min • 1 pt
Which inequality is represented by the graph?
y > (x - 3)² - 3
y ≥ (x + 3)² - 3
y > (x + 3)² - 3
y ≥ (x - 3)² - 3
Tags
CCSS.HSF-IF.C.7A
6.
MULTIPLE CHOICE QUESTION
1 min • 1 pt

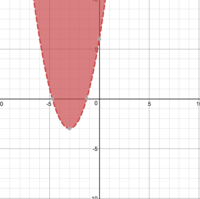
Which inequality is shown?
y< -x2
y≤ -x2
y> -x2
y≥ -x2
Tags
CCSS.HSF-IF.C.7A
7.
MULTIPLE CHOICE QUESTION
1 min • 1 pt

Which inequality is represented by the graph?
y > -(x - 4)² + 1
y > -(x - 1)² + 4
y < (x - 4)² + 1
y > (x + 4)² + 1
Tags
CCSS.HSF-IF.C.7A


Access all questions and much more by creating a free account
Create resources
Host any resource
Get auto-graded reports
Continue with Google

Continue with Email
Continue with Classlink
Continue with Clever
or continue with
Microsoft
%20(1).png)
Apple
Others
Already have an account?
Similar Resources on Wayground
15 questions
Multiplying powers
Quiz
•
8th - 11th Grade
15 questions
Tes Penalaran Matematika
Quiz
•
9th - 12th Grade
10 questions
Matriks Quiz
Quiz
•
11th Grade
18 questions
Rheolau Indecsau - bl.9 (uwch)
Quiz
•
8th - 11th Grade
17 questions
Quadratic Equations: Standard Form
Quiz
•
10th - 11th Grade
13 questions
Evaluating Logarithms Without A Calculator
Quiz
•
11th - 12th Grade
18 questions
Pengetahuan Umum Matematik
Quiz
•
7th - 12th Grade
11 questions
Tablas del 6 y 7
Quiz
•
1st - 12th Grade
Popular Resources on Wayground
7 questions
History of Valentine's Day
Interactive video
•
4th Grade
15 questions
Fractions on a Number Line
Quiz
•
3rd Grade
20 questions
Equivalent Fractions
Quiz
•
3rd Grade
25 questions
Multiplication Facts
Quiz
•
5th Grade
22 questions
fractions
Quiz
•
3rd Grade
15 questions
Valentine's Day Trivia
Quiz
•
3rd Grade
20 questions
Main Idea and Details
Quiz
•
5th Grade
20 questions
Context Clues
Quiz
•
6th Grade
Discover more resources for Mathematics
10 questions
Factor Quadratic Expressions with Various Coefficients
Quiz
•
9th - 12th Grade
10 questions
Evaluating Piecewise Functions Practice
Quiz
•
11th Grade
5 questions
Triangle Congruence Theorems
Interactive video
•
9th - 12th Grade
15 questions
Exponential Growth and Decay Word Problems Practice
Quiz
•
9th - 12th Grade
21 questions
Converting between Logs and Exponents
Quiz
•
11th Grade
20 questions
Classifying polynomials
Quiz
•
11th Grade
20 questions
special right triangles
Quiz
•
9th - 12th Grade
20 questions
Interpreting Scatter Plots
Quiz
•
8th - 12th Grade