Proportions from Tables and Charts
Authored by Anthony Clark
Mathematics
7th Grade
CCSS covered

AI Actions
Add similar questions
Adjust reading levels
Convert to real-world scenario
Translate activity
More...
Content View
Student View
20 questions
Show all answers
1.
MULTIPLE CHOICE QUESTION
1 min • 1 pt

These pie charts show how people travel to work in 2 towns. In which town do more people travel to work by bike?
town A
town B
both the same
impossible to say
Tags
CCSS.6.RP.A.3A
2.
MULTIPLE CHOICE QUESTION
1 min • 1 pt

32 people went to a ice hockey match. The pie chart shows the colours of their shirts. How many people wore black?
45
1
4
3.
MULTIPLE CHOICE QUESTION
1 min • 1 pt
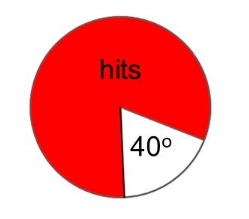
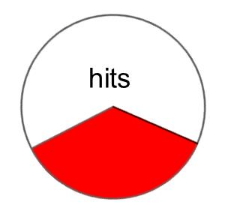
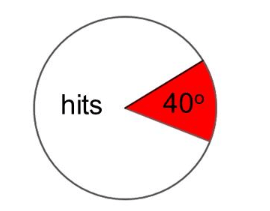
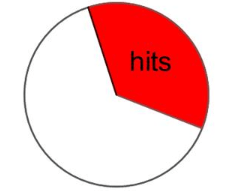
A darts player hits his target 40% of the time. Which pie chart represents his hits and misses?
4.
MULTIPLE CHOICE QUESTION
1 min • 1 pt
Which of the following can not be found using a pie chart?
range
mode
proportions
mean
5.
MULTIPLE CHOICE QUESTION
1 min • 1 pt
Given the graph of a line that passes through the origin and the point (4, 8), which of the following is true about the relationship between x and y?
The relationship is not proportional.
The relationship is proportional, and the constant of proportionality is 0.5.
The relationship is proportional, and the constant of proportionality is 2.
The relationship is proportional, but the constant of proportionality cannot be determined.
Tags
CCSS.7.RP.A.2B
6.
MULTIPLE CHOICE QUESTION
1 min • 1 pt

What is the ratio of tables to chairs?
3:1
3:4
Tags
CCSS.6.RP.A.1
CCSS.6.RP.A.2
7.
MULTIPLE CHOICE QUESTION
1 min • 1 pt

The pie chart shows colours of motorbikes in a shop. There are 20 more blue bikes than white. How many bikes are there altogether?
54
160
40
80
Tags
CCSS.7.EE.B.3


Access all questions and much more by creating a free account
Create resources
Host any resource
Get auto-graded reports
Continue with Google

Continue with Email
Continue with Classlink
Continue with Clever
or continue with
Microsoft
%20(1).png)
Apple
Others
Already have an account?
