Box Plot Analysis and Interpretation
Interactive Video
•
Mathematics
•
9th - 10th Grade
•
Practice Problem
•
Hard

Jackson Turner
FREE Resource
Read more
5 questions
Show all answers
1.
MULTIPLE CHOICE QUESTION
30 sec • 1 pt
What is another name for the middle 50% range in a box plot?
Standard Deviation
Interquartile Range
Mean Absolute Deviation
Variance
2.
MULTIPLE CHOICE QUESTION
30 sec • 1 pt
In the first box plot, what is the value of the first quartile?
91
75
89
78
3.
MULTIPLE CHOICE QUESTION
30 sec • 1 pt
What is the interquartile range of the first box plot?
14
16
10
12
4.
MULTIPLE CHOICE QUESTION
30 sec • 1 pt
In the second box plot, what is the value of the third quartile?
75
89
78
91
5.
MULTIPLE CHOICE QUESTION
30 sec • 1 pt
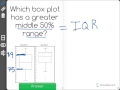
Which box plot has a greater interquartile range?
Box Plot B
Box Plot A
Both have the same range
Cannot be determined
Access all questions and much more by creating a free account
Create resources
Host any resource
Get auto-graded reports
Continue with Google

Continue with Email
Continue with Classlink
Continue with Clever
or continue with
Microsoft
%20(1).png)
Apple
Others
Already have an account?
Similar Resources on Wayground

8 questions
MATHS - Statistics - Histograms
Interactive video
•
9th - 10th Grade
11 questions
Understanding Quadratic Graphs and Functions
Interactive video
•
9th - 10th Grade
11 questions
Trigonometric Functions and Their Inverses
Interactive video
•
9th - 10th Grade
11 questions
Understanding Quadratic Functions and Indefiniteness
Interactive video
•
9th - 10th Grade
11 questions
Graphing Inequalities and Parabolas
Interactive video
•
8th - 10th Grade
11 questions
Understanding Quadratic Graphs Concepts
Interactive video
•
8th - 10th Grade
11 questions
Understanding the Domain and Graphing of a Function
Interactive video
•
8th - 10th Grade
8 questions
Graphing a quadratic using a table
Interactive video
•
9th - 10th Grade
Popular Resources on Wayground
15 questions
Fractions on a Number Line
Quiz
•
3rd Grade
20 questions
Equivalent Fractions
Quiz
•
3rd Grade
25 questions
Multiplication Facts
Quiz
•
5th Grade
22 questions
fractions
Quiz
•
3rd Grade
20 questions
Main Idea and Details
Quiz
•
5th Grade
20 questions
Context Clues
Quiz
•
6th Grade
15 questions
Equivalent Fractions
Quiz
•
4th Grade
20 questions
Figurative Language Review
Quiz
•
6th Grade
Discover more resources for Mathematics
20 questions
Graphing Inequalities on a Number Line
Quiz
•
6th - 9th Grade
12 questions
Exponential Growth and Decay
Quiz
•
9th Grade
20 questions
Exponent Rules Review
Quiz
•
8th - 9th Grade
25 questions
Complementary and Supplementary Angles
Quiz
•
7th - 10th Grade
12 questions
Add and Subtract Polynomials
Quiz
•
9th - 12th Grade
13 questions
Model Exponential Growth and Decay Scenarios
Quiz
•
9th - 12th Grade
15 questions
Combine Like Terms and Distributive Property
Quiz
•
8th - 9th Grade
27 questions
7.2.3 Quadrilateral Properties
Quiz
•
9th - 12th Grade