
Probability and Statistics Post Test 8.ps.1,2,&3
Authored by Jeremy thompson
Mathematics
8th Grade
CCSS covered


AI Actions
Add similar questions
Adjust reading levels
Convert to real-world scenario
Translate activity
More...
Content View
Student View
22 questions
Show all answers
1.
MULTIPLE CHOICE QUESTION
30 sec • 1 pt
Which step involves analyzing and justifying the relationship of the quantitative bivariate data in scatterplots?
Analyze data
Organize data
Collect data
Formulate questions
Tags
CCSS.8.SP.A.1
2.
MULTIPLE CHOICE QUESTION
30 sec • 1 pt
What is the purpose of sketching the line of best fit in a scatterplot?
To represent the trend in the data
To make the data look neat
To show the average of the data points
To confuse the viewer
Tags
CCSS.8.SP.A.2
3.
MULTIPLE CHOICE QUESTION
30 sec • 1 pt
In a scatterplot, what does a no relationship scenario look like?
Points scattered randomly
Points forming a curve
Points forming a straight line going upwards
Points forming a straight line going downwards
Tags
CCSS.HSS.ID.B.5
4.
MULTIPLE CHOICE QUESTION
20 sec • 1 pt

What type of association does this scatter plot represent?
positive linear association
negative association
no association
nonlinear association
Tags
CCSS.HSS.ID.B.5
5.
MULTIPLE CHOICE QUESTION
30 sec • 1 pt
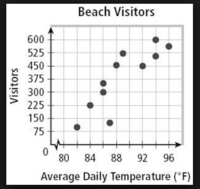
Which sentence describes the relationship shown on this scatter plot?
As the temperature decreases, the visitors increase.
As the temperature increases, the number of visitors increases.
As the visitors increase, the temperature decreases.
No correlation
Tags
CCSS.L.1.6
CCSS.L.3.6
CCSS.RI.K.7
6.
MULTIPLE CHOICE QUESTION
20 sec • 1 pt

Describe the correlation in the graph shown.
Strong Negative
Strong Positive
Weak Negative
Weak Positive
Tags
CCSS.HSF-LE.A.1B
7.
MULTIPLE CHOICE QUESTION
30 sec • 1 pt
What is the main goal of analyzing and justifying the relationship of quantitative bivariate data in scatterplots?
To make the data look messy
To identify trends and patterns
To avoid data analysis
To confuse the viewer
Tags
CCSS.8.SP.A.1
Access all questions and much more by creating a free account
Create resources
Host any resource
Get auto-graded reports

Continue with Google

Continue with Email

Continue with Microsoft
or continue with

%20(1).png)
Apple

Others
Already have an account?


