Linear Relationships Quiz
Authored by Yenifer Gaytan
Mathematics
8th Grade
CCSS covered
Used 5+ times

AI Actions
Add similar questions
Adjust reading levels
Convert to real-world scenario
Translate activity
More...
Content View
Student View
11 questions
Show all answers
1.
MULTIPLE CHOICE QUESTION
5 mins • 1 pt

Which statement correctly describes the relationship represented by the graph?
The relationship is linear and proportional.
The relationship is linear and non-proportional.
The relationship is non-linear and proportional.
The relationship is non-linear and non-proportional.
Tags
CCSS.8.F.A.3
2.
MULTIPLE CHOICE QUESTION
30 sec • 1 pt

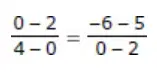
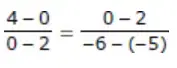
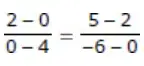
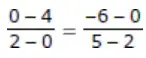
Triangle ABC and triangle EBD are similar right triangles. The coordinates of all vertices are integers. Which statement is true about the slope of BC and the slope of BD?
The relationship between the slope of BC and the slope of BD cannot be determined because the triangles are overlapping.
The slope of BC is greater than the slope of BD, because the ratio of the change in y-values of the endpoints to the change in x-values of the endpoints is greater for BC than it is for BD.
The slope of BC is less than the slope of BD, because the ratio of the change in y-values of the endpoints to the change in x-values of the endpoints is less for BC than it is for segment BD.
The slope of BC is equal to the slope of BD, because the ratio of the change in y-values of the endpoints to the change in x-values of the endpoints is the same for BC as it is for BD.
Tags
CCSS.8.EE.B.6
3.
MULTIPLE CHOICE QUESTION
30 sec • 1 pt
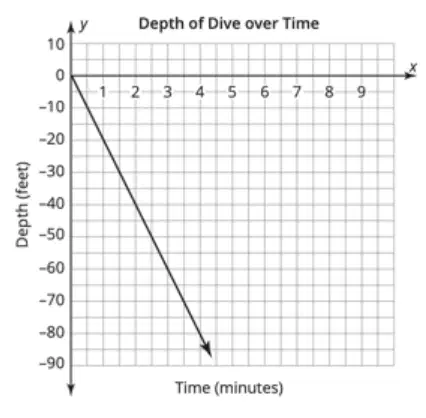
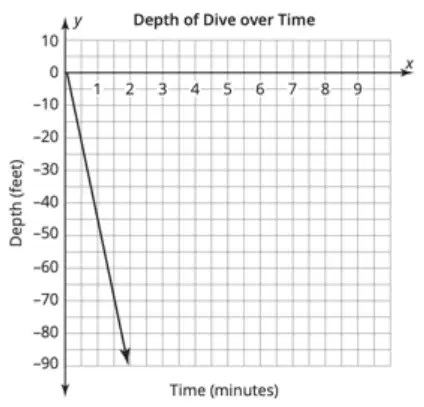
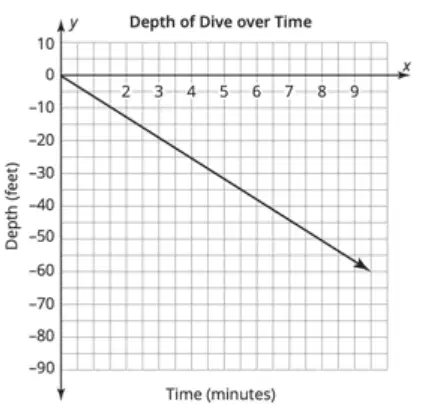
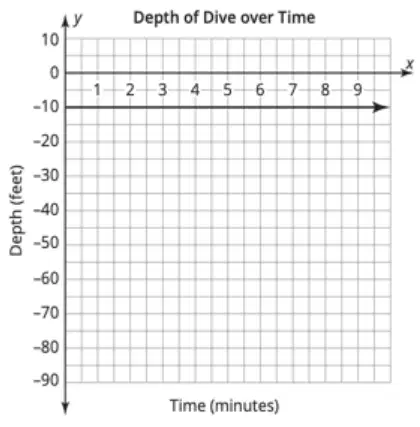
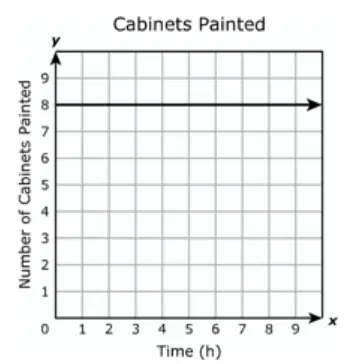
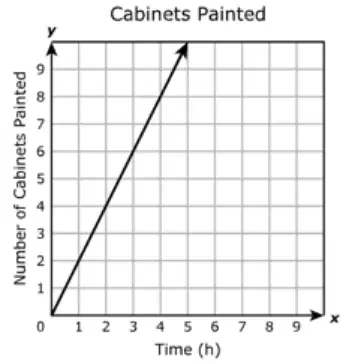
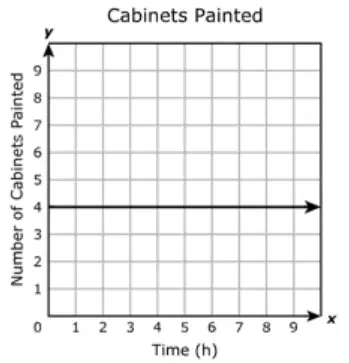
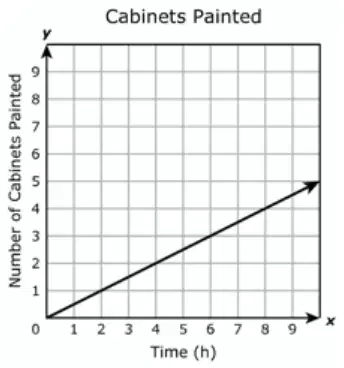
A deep sea diver swims downwards 20 feet every minute. Which graph has a slope that best represents this rate?
Tags
CCSS.8.EE.B.5
4.
MULTIPLE CHOICE QUESTION
30 sec • 1 pt

Determine whether graph A represents a proportional relationship. Explain your reasoning.
Graph A represents a proportional relationship because it does pass through the origin.
Graph A represents a proportional relationship because it does not pass through the origin.
Graph A represents a non-proportional relationship because it does pass through the origin.
Graph A represents a non-proportional relationship because it does not pass through the origin.
Tags
CCSS.7.RP.A.2D
5.
MULTIPLE CHOICE QUESTION
30 sec • 1 pt

Determine whether graph B represents a proportional relationship. Explain your reasoning.
Graph B represents a proportional relationship because it does pass through the origin.
Graph B represents a proportional relationship because it does not pass through the origin.
Graph B represents a non-proportional relationship because it does pass through the origin.
Graph B represents a non-proportional relationship because it does not pass through the origin.
Tags
CCSS.7.RP.A.2D
6.
MULTIPLE CHOICE QUESTION
30 sec • 1 pt

Consider the graph shown. Determine the slope of the graph.
Tags
CCSS.8.EE.B.5
7.
MULTIPLE CHOICE QUESTION
30 sec • 1 pt
The value of y varies directly with x. When y = 12, x = 1.5. What is the value of y when x is 9?
72
27
8
0.125

Access all questions and much more by creating a free account
Create resources
Host any resource
Get auto-graded reports
Continue with Google

Continue with Email
Continue with Classlink
Continue with Clever
or continue with
Microsoft
%20(1).png)
Apple
Others
Already have an account?
