Exploring Lines of Best Fit in Algebra
Interactive Video
•
Mathematics
•
6th - 10th Grade
•
Practice Problem
•
Medium
+1
Standards-aligned

Amelia Wright
Used 3+ times
FREE Resource
Standards-aligned
Read more
10 questions
Show all answers
1.
MULTIPLE CHOICE QUESTION
30 sec • 1 pt
What is the purpose of a line of best fit in a scatter plot?
To connect all the data points
To show the average trend of the data
To highlight the highest and lowest points
To separate the data into two groups
Tags
CCSS.8.SP.A.2
2.
MULTIPLE CHOICE QUESTION
30 sec • 1 pt
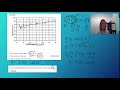
In the given scatter plot, what does the x-axis represent?
Temperature
Time
Cricket chirps per second
Number of crickets
3.
MULTIPLE CHOICE QUESTION
30 sec • 1 pt
How would you describe a positive correlation in a scatter plot?
As one variable increases, the other decreases
There is no relationship between the variables
As one variable increases, the other also increases
The variables are inversely proportional
Tags
CCSS.HSS.ID.B.5
4.
MULTIPLE CHOICE QUESTION
30 sec • 1 pt
What indicates a strong correlation in a scatter plot?
Data points are widely scattered
Data points form a vertical line
Data points form a horizontal line
Data points are close to the line of best fit
Tags
CCSS.HSS.ID.B.5
5.
MULTIPLE CHOICE QUESTION
30 sec • 1 pt
When drawing a line of best fit, what should you ensure about the data points?
Points should be equidistant on both sides of the line
All points should be above the line
Points should be connected by the line
All points should be below the line
Tags
CCSS.8.EE.B.5
6.
MULTIPLE CHOICE QUESTION
30 sec • 1 pt
Which two points were selected to calculate the slope in the example?
(15, 74) and (18, 84)
(16, 74) and (18, 84)
(16, 71) and (18, 85)
(15, 71) and (18, 85)
Tags
CCSS.8.EE.B.5
7.
MULTIPLE CHOICE QUESTION
30 sec • 1 pt
What is the formula used to calculate the slope of the line?
(y1 - y2) / (x1 - x2)
(y2 - y1) / (x2 - x1)
(x1 - x2) / (y1 - y2)
(x2 - x1) / (y2 - y1)
Tags
CCSS.8.EE.B.5
Access all questions and much more by creating a free account
Create resources
Host any resource
Get auto-graded reports
Continue with Google

Continue with Email
Continue with Classlink
Continue with Clever
or continue with
Microsoft
%20(1).png)
Apple
Others
Already have an account?
