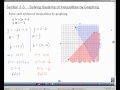
Solving Systems of Inequalities by Graphing
Interactive Video
•
Mathematics
•
8th - 12th Grade
•
Practice Problem
•
Hard
Standards-aligned

Mia Campbell
FREE Resource
Standards-aligned
10 questions
Show all answers
1.
MULTIPLE CHOICE QUESTION
30 sec • 1 pt
What is the slope of the first boundary line in the initial example?
-1
2
-2
1
2.
MULTIPLE CHOICE QUESTION
30 sec • 1 pt
Why is the first boundary line dotted?
Because it represents a less than inequality
Because it represents an equal to inequality
Because it represents a less than or equal to inequality
Because it represents a greater than inequality without an equal to sign
Tags
CCSS.HSA.REI.D.12
3.
MULTIPLE CHOICE QUESTION
30 sec • 1 pt
What point is used to test the shading region for the first inequality?
(2,2)
(0,0)
(0,4)
(1,1)
Tags
CCSS.HSA.REI.D.12
4.
MULTIPLE CHOICE QUESTION
30 sec • 1 pt
What is the y-intercept of the second boundary line in the initial example?
(0,-4)
(0,4)
(0,2)
(0,-2)
Tags
CCSS.HSA.REI.D.12
5.
MULTIPLE CHOICE QUESTION
30 sec • 1 pt
Where do the shaded regions of the first and second inequalities overlap?
Top left region
Bottom left region
Bottom right region
Top right region
Tags
CCSS.HSA.REI.D.12
6.
MULTIPLE CHOICE QUESTION
30 sec • 1 pt
What is the slope of the boundary line in the new set of inequalities?
1/2
1
2
-1
Tags
CCSS.8.EE.C.8B
7.
MULTIPLE CHOICE QUESTION
30 sec • 1 pt
How is the absolute value inequality rewritten?
As a quadratic equation
As a linear equation
As two separate inequalities
As a single inequality
Access all questions and much more by creating a free account
Create resources
Host any resource
Get auto-graded reports
Continue with Google

Continue with Email
Continue with Classlink
Continue with Clever
or continue with
Microsoft
%20(1).png)
Apple
Others
Already have an account?
