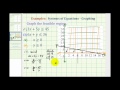
Graphing Inequalities and Feasible Regions
Interactive Video
•
Mathematics
•
9th - 12th Grade
•
Practice Problem
•
Easy
Standards-aligned

Jackson Turner
Used 1+ times
FREE Resource
Standards-aligned
Read more
10 questions
Show all answers
1.
MULTIPLE CHOICE QUESTION
30 sec • 1 pt
What is the purpose of graphing the feasible region?
To find the area where all inequalities are satisfied
To calculate the slope of a line
To determine the maximum value of a function
To identify the intersection of two lines
Tags
CCSS.HSA.REI.D.12
2.
MULTIPLE CHOICE QUESTION
30 sec • 1 pt
Which line represents the boundary for inequality 3?
Line Y = 0
Line X = 0
X-axis
Y-axis
Tags
CCSS.HSA.REI.D.12
3.
MULTIPLE CHOICE QUESTION
30 sec • 1 pt
For inequality 4, where do we shade the region?
To the right of the vertical line
To the left of the vertical line
Above the horizontal line
Below the horizontal line
Tags
CCSS.8.EE.B.6
CCSS.8.F.A.3
4.
MULTIPLE CHOICE QUESTION
30 sec • 1 pt
What is the Y-intercept of the line 3X + 5Y = 45?
(0, 9)
(0, 15)
(15, 0)
(9, 0)
Tags
CCSS.HSA.REI.D.12
5.
MULTIPLE CHOICE QUESTION
30 sec • 1 pt
How do you determine where to shade for inequality 1?
By using the distance formula
By calculating the midpoint of the line
By finding the slope of the line
By checking if the origin satisfies the inequality
6.
MULTIPLE CHOICE QUESTION
30 sec • 1 pt
What is the X-intercept of the line 6X + Y = 36?
(0, 6)
(36, 0)
(6, 0)
(0, 36)
Tags
CCSS.HSA.REI.D.12
7.
MULTIPLE CHOICE QUESTION
30 sec • 1 pt
Which point is used to test the shading for inequality 2?
(0, 0)
(1, 1)
(6, 0)
(0, 36)
Tags
CCSS.HSA.REI.D.12
Access all questions and much more by creating a free account
Create resources
Host any resource
Get auto-graded reports
Continue with Google

Continue with Email
Continue with Classlink
Continue with Clever
or continue with
Microsoft
%20(1).png)
Apple
Others
Already have an account?
