Graphing Ratio Tables Explained
Interactive Video
•
Mathematics
•
6th - 10th Grade
•
Practice Problem
•
Medium
+4
Standards-aligned

Emma Peterson
Used 5+ times
FREE Resource
Standards-aligned
10 questions
Show all answers
1.
MULTIPLE CHOICE QUESTION
30 sec • 1 pt
What do ratio tables represent?
Different values
Equivalent values
Opposite values
Random values
Tags
CCSS.7.RP.A.2D
2.
MULTIPLE CHOICE QUESTION
30 sec • 1 pt
How do we graph equivalent ratios?
By using random numbers
By using numbers from the ratio table to create ordered pairs
By guessing the values
By using only the x-values
Tags
CCSS.7.RP.A.2D
3.
MULTIPLE CHOICE QUESTION
30 sec • 1 pt
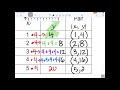
What is the ordered pair for 1 hour of babysitting?
(1, 1)
(4, 4)
(1, 4)
(4, 1)
Tags
CCSS.6.RP.A.3B
4.
MULTIPLE CHOICE QUESTION
30 sec • 1 pt
If Anna works 2 hours, how much does she earn?
$6
$4
$8
$10
Tags
CCSS.5.OA.B.3
5.
MULTIPLE CHOICE QUESTION
30 sec • 1 pt
What is the ordered pair for 3 hours of babysitting?
(3, 8)
(3, 12)
(3, 16)
(3, 20)
Tags
CCSS.3.OA.D.9
6.
MULTIPLE CHOICE QUESTION
30 sec • 1 pt
What pattern do we see in Anna's earnings?
Multiplication by 3
Addition of 2
Multiplication by 4
Addition of 4
Tags
CCSS.7.RP.A.2B
7.
MULTIPLE CHOICE QUESTION
30 sec • 1 pt
What does the x-axis represent in the graph?
Days worked
Number of babysitters
Hours worked
Dollars earned
Tags
CCSS.5.OA.B.3
Access all questions and much more by creating a free account
Create resources
Host any resource
Get auto-graded reports
Continue with Google

Continue with Email
Continue with Microsoft
or continue with

%20(1).png)
Apple
Others
Already have an account?
