Exploring Positive and Negative Correlation in Scatter Plots
Interactive Video
•
Mathematics
•
6th - 10th Grade
•
Practice Problem
•
Hard
Standards-aligned

Aiden Montgomery
FREE Resource
Standards-aligned
Read more
10 questions
Show all answers
1.
MULTIPLE CHOICE QUESTION
30 sec • 1 pt
What is a scatter plot?
A graph that shows a single line.
A graph that shows a collection of ordered pairs.
A graph that shows only positive trends.
A graph that shows only negative trends.
Tags
CCSS.HSS.ID.B.5
2.
MULTIPLE CHOICE QUESTION
30 sec • 1 pt
What does a positive correlation indicate?
As one variable increases, the other also increases.
There is no relationship between the variables.
The variables remain constant.
As one variable increases, the other decreases.
Tags
CCSS.HSF-LE.A.1B
3.
MULTIPLE CHOICE QUESTION
30 sec • 1 pt
Which of the following is an example of positive correlation?
As the age of a car increases, its value decreases.
As the number of hours spent watching TV increases, the time spent on homework decreases.
As the age of a child increases, their height increases.
There is no relationship between shoe size and batting average.
Tags
CCSS.HSS.ID.B.5
4.
MULTIPLE CHOICE QUESTION
30 sec • 1 pt
What does a negative correlation indicate?
As one variable increases, the other also increases.
As one variable increases, the other decreases.
There is no relationship between the variables.
The variables remain constant.
Tags
CCSS.HSS.ID.B.5
5.
MULTIPLE CHOICE QUESTION
30 sec • 1 pt
Which of the following is an example of negative correlation?
As the age of a child increases, their height increases.
As the age of a car increases, its value decreases.
There is no relationship between shoe size and batting average.
As the number of hours spent watching TV increases, the time spent on homework increases.
Tags
CCSS.HSS.ID.B.5
6.
MULTIPLE CHOICE QUESTION
30 sec • 1 pt
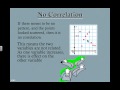
What does no correlation indicate?
There is no relationship between the variables.
The variables remain constant.
As one variable increases, the other decreases.
As one variable increases, the other also increases.
Tags
CCSS.HSS.ID.B.5
7.
MULTIPLE CHOICE QUESTION
30 sec • 1 pt
Which of the following is an example of no correlation?
As the age of a child increases, their height increases.
There is no relationship between shoe size and batting average.
As the number of hours spent watching TV increases, the time spent on homework decreases.
As the age of a car increases, its value decreases.
Tags
CCSS.HSS.ID.C.9
Access all questions and much more by creating a free account
Create resources
Host any resource
Get auto-graded reports
Continue with Google

Continue with Email
Continue with Classlink
Continue with Clever
or continue with
Microsoft
%20(1).png)
Apple
Others
Already have an account?
