- Resource Library
- Math
- Data And Graphing
- Scatter Plot Association
- Exploring Scatter Plots And Lines Of Best Fit
Exploring Scatter Plots and Lines of Best Fit
Interactive Video
•
Mathematics
•
6th - 10th Grade
•
Practice Problem
•
Hard
+4
Standards-aligned

Liam Anderson
Used 2+ times
FREE Resource
Standards-aligned
Read more
10 questions
Show all answers
1.
MULTIPLE CHOICE QUESTION
30 sec • 1 pt
What is the primary purpose of using scatter plots in data analysis?
To understand the relationship between two variables
To create a perfect linear relationship between variables
To find the highest value in a data set
To calculate the exact values of data points
Tags
CCSS.HSA-SSE.B.3B
CCSS.HSF-IF.C.8A
2.
MULTIPLE CHOICE QUESTION
30 sec • 1 pt
What does a positive association in a scatter plot indicate?
As one variable decreases, the other increases
Both variables decrease together
Both variables increase together
There is no relationship between the variables
Tags
CCSS.HSF-LE.A.1B
3.
MULTIPLE CHOICE QUESTION
30 sec • 1 pt
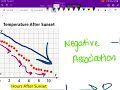
What signifies a negative association in a scatter plot?
Both variables increase at the same rate
Both variables move in opposite directions
Both variables decrease at the same rate
There is no change in either variable
Tags
CCSS.HSF-LE.A.1B
4.
MULTIPLE CHOICE QUESTION
30 sec • 1 pt
What does it mean if a scatter plot has no association?
The variables decrease together
There is no discernible pattern between the variables
The variables increase together
One variable increases as the other decreases
Tags
CCSS.HSF-LE.A.1B
5.
MULTIPLE CHOICE QUESTION
30 sec • 1 pt
How can a line of best fit be described?
A line that perfectly predicts future data points
A line with a negative slope only
A line that approximates the trend of the data
A line that passes through all data points
Tags
CCSS.8.EE.B.5
6.
MULTIPLE CHOICE QUESTION
30 sec • 1 pt
What is the difference between positive association and positive correlation?
Positive correlation involves drawing a line of best fit
Positive association requires exact calculations
There is no difference; they mean the same thing
Positive correlation can only be determined mathematically
Tags
CCSS.HSS.ID.C.9
7.
MULTIPLE CHOICE QUESTION
30 sec • 1 pt
What is the slope-intercept form of a linear equation?
x = b + my
y = mx + b
y = b + mx
x = my + b
Tags
CCSS.8.EE.B.6
CCSS.8.F.A.3
Access all questions and much more by creating a free account
Create resources
Host any resource
Get auto-graded reports
Continue with Google

Continue with Email
Continue with Microsoft
or continue with

%20(1).png)
Apple
Others
Already have an account?
