- Resource Library
- Math
- Probability And Statistics
- Correlation And Coefficients
- Scatter Plots And Linear Regression Concepts
Scatter Plots and Linear Regression Concepts
Interactive Video
•
Mathematics
•
6th - 10th Grade
•
Practice Problem
•
Hard
+2
Standards-aligned

Amelia Wright
Used 1+ times
FREE Resource
Standards-aligned
Read more
10 questions
Show all answers
1.
MULTIPLE CHOICE QUESTION
30 sec • 1 pt
What generally happens to test scores as the number of incorrect answers increases?
Test scores increase
Test scores decrease
Test scores remain the same
There is no predictable pattern
Tags
CCSS.HSF-LE.A.1B
2.
MULTIPLE CHOICE QUESTION
30 sec • 1 pt
What defines a negative correlation?
There is no relationship between the variables
As one variable increases, the other decreases
Both variables decrease together
Both variables increase together
Tags
CCSS.HSS.ID.B.5
3.
MULTIPLE CHOICE QUESTION
30 sec • 1 pt
What trend is observed between hours of sleep and test scores?
Negative correlation
Positive correlation
No correlation
Inconsistent correlation
Tags
CCSS.HSF-LE.A.1B
4.
MULTIPLE CHOICE QUESTION
30 sec • 1 pt
How do you activate diagnostics on a TI-84 calculator for correlation coefficient calculation?
Both A and B are correct
Press '2nd' and '0' for catalog
Press 'mode' and select 'diagnostics on'
It's not possible to activate diagnostics
Tags
CCSS.HSS.ID.C.8
5.
MULTIPLE CHOICE QUESTION
30 sec • 1 pt
What does a correlation coefficient close to -1 indicate?
Strong positive correlation
Strong negative correlation
No correlation
Weak correlation
Tags
CCSS.HSS.ID.B.5
6.
MULTIPLE CHOICE QUESTION
30 sec • 1 pt
What does a strong positive correlation coefficient indicate?
As one variable increases, the other significantly decreases
As one variable increases, the other slightly increases
As one variable increases, the other significantly increases
There is no relationship between the variables
Tags
CCSS.HSS.ID.B.5
7.
MULTIPLE CHOICE QUESTION
30 sec • 1 pt
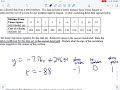
How is the linear regression equation represented in the tutorial?
y = mx + b
y = b + mx
x = my + b
x = b + my
Tags
CCSS.8.EE.B.5
Access all questions and much more by creating a free account
Create resources
Host any resource
Get auto-graded reports
Continue with Google

Continue with Email
Continue with Microsoft
or continue with

%20(1).png)
Apple
Others
Already have an account?
