- Resource Library
- Math
- Data And Graphing
- Interpreting Linear Graphs
- Solving Real World Problems With Graphing Linear Equations
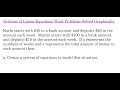
Solving Real-World Problems with Graphing Linear Equations
Interactive Video
•
Mathematics
•
6th - 10th Grade
•
Practice Problem
•
Hard
+8
Standards-aligned

Mia Campbell
FREE Resource
Standards-aligned
Read more
10 questions
Show all answers
1.
MULTIPLE CHOICE QUESTION
30 sec • 1 pt
What is the initial amount of money Karla has in her bank account?
$20
$40
$100
$10
Tags
CCSS.8.F.B.4
CCSS.HSF.LE.A.2
2.
MULTIPLE CHOICE QUESTION
30 sec • 1 pt
What is the equation representing Martin's bank account balance?
y = 10x + 100
y = 100x + 10
y = 20x + 40
y = 40x + 20
Tags
CCSS.6.EE.C.9
3.
MULTIPLE CHOICE QUESTION
30 sec • 1 pt
How should the y-axis be scaled to accommodate both Karla's and Martin's y-intercepts?
By 20s
By 5s
By 10s
By 50s
Tags
CCSS.HSF-IF.C.7A
4.
MULTIPLE CHOICE QUESTION
30 sec • 1 pt
What is the slope of Karla's line?
40
20
10
100
Tags
CCSS.8.EE.B.5
5.
MULTIPLE CHOICE QUESTION
30 sec • 1 pt
After how many weeks will Karla and Martin have the same amount of money?
4 weeks
5 weeks
7 weeks
6 weeks
Tags
CCSS.8.EE.C.8C
6.
MULTIPLE CHOICE QUESTION
30 sec • 1 pt
Who will save $200 faster, Karla or Martin?
Karla
Martin
Neither
Both at the same time
Tags
CCSS.8.F.A.2
CCSS.HSF.IF.C.9
7.
MULTIPLE CHOICE QUESTION
30 sec • 1 pt
What is the initial amount Sam borrowed from her parents?
$700
$600
$500
$400
Tags
CCSS.8.F.B.4
CCSS.HSF.LE.A.2
Access all questions and much more by creating a free account
Create resources
Host any resource
Get auto-graded reports
Continue with Google

Continue with Email
Continue with Microsoft
or continue with

%20(1).png)
Apple
Others
Already have an account?
