Interpreting Graphs and Relationships in Integrated Math
Interactive Video
•
Mathematics
•
6th - 10th Grade
•
Practice Problem
•
Hard
+2
Standards-aligned

Jackson Turner
FREE Resource
Standards-aligned
10 questions
Show all answers
1.
MULTIPLE CHOICE QUESTION
30 sec • 1 pt
What is the main topic of the lesson?
Solving equations
Calculating areas
Understanding fractions
Graphing relationships and interpreting graphs
Tags
CCSS.7.RP.A.2B
2.
MULTIPLE CHOICE QUESTION
30 sec • 1 pt
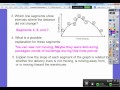
What does the graph of the delivery van's distance from the warehouse show?
The fuel consumption of the van
The number of deliveries made
The speed of the van
The distance from the warehouse over time
Tags
CCSS.HSF.IF.B.4
3.
MULTIPLE CHOICE QUESTION
30 sec • 1 pt
What does segment 2 of the graph indicate about the van's movement?
The van is stopped
The van is returning to the warehouse
The van is moving away at a slower speed
The van is moving away at a faster speed
Tags
CCSS.HSF.IF.B.4
4.
MULTIPLE CHOICE QUESTION
30 sec • 1 pt
Which segments show that the van is not moving?
6, 8, and 9
3, 5, and 7
1, 2, and 4
2, 4, and 6
Tags
CCSS.HSF.IF.B.4
5.
MULTIPLE CHOICE QUESTION
30 sec • 1 pt
What does a positive slope in the graph indicate?
The van is moving at a constant speed
The van is moving away from the warehouse
The van is stopped
The van is moving towards the warehouse
Tags
CCSS.HSF.LE.B.5
6.
MULTIPLE CHOICE QUESTION
30 sec • 1 pt
Which graph represents the water barrel being filled at a constant rate?
Graph A
Graph B
Graph C
None of the above
Tags
CCSS.8.EE.B.5
7.
MULTIPLE CHOICE QUESTION
30 sec • 1 pt
What does graph A represent in the water barrel scenario?
A hose that starts fast and slows down
A hose that starts slow and speeds up
A hose that fills at a constant rate
A hose that stops and starts
Tags
CCSS.8.EE.B.5
Access all questions and much more by creating a free account
Create resources
Host any resource
Get auto-graded reports
Continue with Google

Continue with Email
Continue with Microsoft
or continue with

%20(1).png)
Apple
Others
Already have an account?
