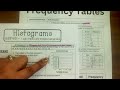
Exploring Frequency Tables and Histograms
Interactive Video
•
Mathematics
•
6th - 10th Grade
•
Practice Problem
•
Hard
+3
Standards-aligned

Lucas Foster
FREE Resource
Standards-aligned
10 questions
Show all answers
1.
MULTIPLE CHOICE QUESTION
30 sec • 1 pt
What is the purpose of intervals in a frequency table?
To group data values
To calculate the mean
To determine the mode
To find the median
Tags
CCSS.6.SP.B.4
CCSS.HSS.ID.A.1
2.
MULTIPLE CHOICE QUESTION
30 sec • 1 pt
How do you represent the frequency of data values in a frequency table?
Using tally marks
Using bar graphs
Using pie charts
Using line graphs
3.
MULTIPLE CHOICE QUESTION
30 sec • 1 pt
In the example, which interval does the number 81 fall into?
81 to 90
61 to 70
51 to 60
71 to 80
Tags
CCSS.5.NBT.A.2
4.
MULTIPLE CHOICE QUESTION
30 sec • 1 pt
What is a histogram?
A bar graph showing the frequency of data values
A line graph showing data trends
A pie chart showing data proportions
A scatter plot showing data distribution
Tags
CCSS.6.SP.B.4
CCSS.HSS.ID.A.1
5.
MULTIPLE CHOICE QUESTION
30 sec • 1 pt
What does the height of a bar in a histogram represent?
The frequency of data values
The median of data values
The mean of data values
The mode of data values
Tags
CCSS.6.SP.B.4
CCSS.HSS.ID.A.1
6.
MULTIPLE CHOICE QUESTION
30 sec • 1 pt
Why can't you determine the mean, median, or mode from a histogram?
Because it shows the range of data
Because it shows grouped data, not individual values
Because it shows the standard deviation
Because it shows the total sum of data
Tags
CCSS.6.SP.B.4
CCSS.HSS.ID.A.1
7.
MULTIPLE CHOICE QUESTION
30 sec • 1 pt
How many runners ran a maximum of 15 laps in the example?
19
23
26
10
Tags
CCSS.5.G.A.2
Access all questions and much more by creating a free account
Create resources
Host any resource
Get auto-graded reports
Continue with Google

Continue with Email
Continue with Microsoft
or continue with

%20(1).png)
Apple
Others
Already have an account?
