Comparing Box and Whisker Plots
Interactive Video
•
Mathematics
•
6th - 10th Grade
•
Practice Problem
•
Hard
+1
Standards-aligned

Emma Peterson
FREE Resource
Standards-aligned
10 questions
Show all answers
1.
MULTIPLE CHOICE QUESTION
30 sec • 1 pt
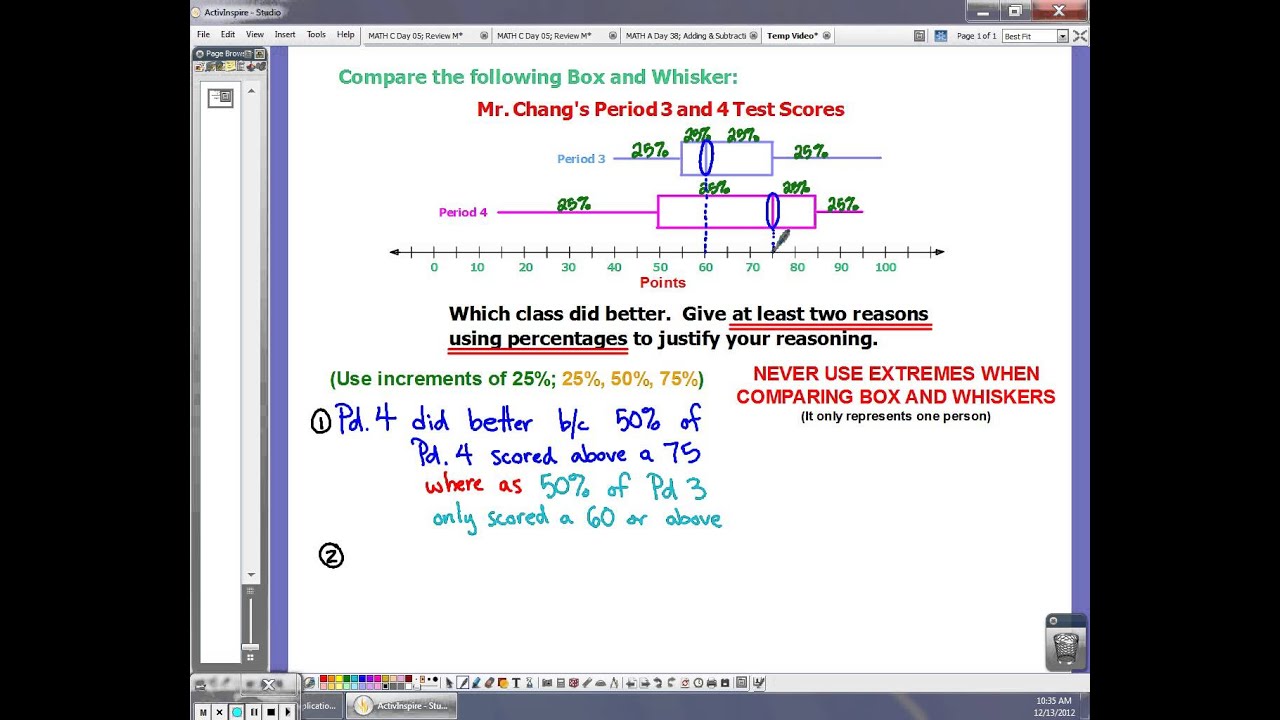
What is the primary reason for using increments of 25% in box and whisker plots?
To make the plots look more balanced
Because each section represents 25% of the data
To simplify the calculation process
To align with statistical standards
Tags
CCSS.6.SP.B.4
CCSS.HSS.ID.A.1
2.
MULTIPLE CHOICE QUESTION
30 sec • 1 pt
Why do we avoid using the extremes when comparing box and whisker plots?
They do not provide useful information
They only represent one person
They represent outliers
They are difficult to calculate
Tags
CCSS.7.SP.B.4
3.
MULTIPLE CHOICE QUESTION
30 sec • 1 pt
Which period had a higher median score?
The video does not specify
Both were equal
Period 4
Period 3
Tags
CCSS.HSS.ID.A.3
4.
MULTIPLE CHOICE QUESTION
30 sec • 1 pt
What percentage of Period 4 scored above 75?
25%
100%
50%
75%
Tags
CCSS.6.SP.B.4
CCSS.HSS.ID.A.1
5.
MULTIPLE CHOICE QUESTION
30 sec • 1 pt
Why is comparing medians useful in box and whisker plots?
It calculates the average score
It represents the middle point of data
It indicates the highest score
It shows the range of scores
Tags
CCSS.7.SP.B.4
6.
MULTIPLE CHOICE QUESTION
30 sec • 1 pt
How does the upper quartile of Period 3 compare to Period 4?
Period 4 is higher
Both are the same
Period 3 is higher
The video does not specify
Tags
CCSS.HSS.ID.A.3
7.
MULTIPLE CHOICE QUESTION
30 sec • 1 pt
What does the upper quartile represent in a box and whisker plot?
The average score
The highest 25% of scores
The median score
The lowest 25% of scores
Tags
CCSS.6.SP.B.4
CCSS.HSS.ID.A.1
Access all questions and much more by creating a free account
Create resources
Host any resource
Get auto-graded reports
Continue with Google

Continue with Email
Continue with Classlink
Continue with Clever
or continue with
Microsoft
%20(1).png)
Apple
Others
Already have an account?
