Mastering Dot Plots and Data Analysis
Interactive Video
•
Mathematics
•
6th - 10th Grade
•
Practice Problem
•
Medium
+1
Standards-aligned

Emma Peterson
Used 27+ times
FREE Resource
Standards-aligned
10 questions
Show all answers
1.
MULTIPLE CHOICE QUESTION
30 sec • 1 pt
What does the mean represent in a dot plot?
The average value of the data set
The most frequently occurring value
The difference between the highest and lowest values
The middle value of the data set
Tags
CCSS.6.SP.B.5C
2.
MULTIPLE CHOICE QUESTION
30 sec • 1 pt
What does a skewed dot plot indicate?
An even distribution of data
A concentration of data on one side
No outliers present
All values are the same
3.
MULTIPLE CHOICE QUESTION
30 sec • 1 pt
What is a cluster in the context of a dot plot?
A large gap between data points
The range of the data set
A single outlier dot
A group of closely located dots
4.
MULTIPLE CHOICE QUESTION
30 sec • 1 pt
How is the median found in a dot plot?
By locating the middle dot in the data set
By subtracting the smallest value from the largest
By calculating the average of all data points
By identifying the tallest stack of dots
Tags
CCSS.6.SP.B.4
CCSS.HSS.ID.A.1
5.
MULTIPLE CHOICE QUESTION
30 sec • 1 pt
Which score was the median for the player's basketball scores?
12 points
16 points
18 points
22 points
Tags
CCSS.6.SP.B.5C
6.
MULTIPLE CHOICE QUESTION
30 sec • 1 pt
What does the mode indicate in a dot plot?
The value that occurs most frequently
The average of all data points
The spread of the data
The middle value of the data set
Tags
CCSS.6.SP.B.4
CCSS.HSS.ID.A.1
7.
MULTIPLE CHOICE QUESTION
30 sec • 1 pt
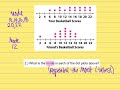
What was the mode for the friend's basketball scores?
10 points
12 points
14 points
16 points
Tags
CCSS.6.SP.B.5C
Access all questions and much more by creating a free account
Create resources
Host any resource
Get auto-graded reports
Continue with Google

Continue with Email
Continue with Microsoft
or continue with

%20(1).png)
Apple
Others
Already have an account?
