Interpreting Bar Graphs and Pictographs for 2nd Graders
Interactive Video
•
Mathematics
•
6th - 10th Grade
•
Practice Problem
•
Easy
+1
Standards-aligned

Jackson Turner
Used 1+ times
FREE Resource
Standards-aligned
Read more
10 questions
Show all answers
1.
MULTIPLE CHOICE QUESTION
30 sec • 1 pt
What direction can bar graphs be oriented?
In a circular pattern
Both vertically and horizontally
Only horizontally
Only vertically
Tags
CCSS.2.MD.D.10
2.
MULTIPLE CHOICE QUESTION
30 sec • 1 pt
Which snack was preferred by the majority?
Fruit
Candy
Crackers
Vegetables
Tags
CCSS.2.MD.D.10
3.
MULTIPLE CHOICE QUESTION
30 sec • 1 pt
What activity is suggested after finding out how many people prefer fruit?
Jumping jacks
Lunges
Windmills
Crab kicks
Tags
CCSS.1.MD.C.4
4.
MULTIPLE CHOICE QUESTION
30 sec • 1 pt
Which snack was least preferred by people?
Vegetables
Fruit
Crackers
Candy
Tags
CCSS.2.MD.D.10
5.
MULTIPLE CHOICE QUESTION
30 sec • 1 pt
How many students preferred both soccer and basketball?
25
9
15
6
Tags
CCSS.8.SP.A.4
6.
MULTIPLE CHOICE QUESTION
30 sec • 1 pt
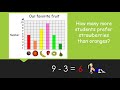
By how many students were strawberries preferred over oranges?
3
6
12
9
Tags
CCSS.3.MD.B.3
7.
MULTIPLE CHOICE QUESTION
30 sec • 1 pt
Which subject was least preferred according to the pictograph?
Math
Science
English
Social Studies
Tags
CCSS.1.MD.C.4
Access all questions and much more by creating a free account
Create resources
Host any resource
Get auto-graded reports
Continue with Google

Continue with Email
Continue with Classlink
Continue with Clever
or continue with
Microsoft
%20(1).png)
Apple
Others
Already have an account?
