Exploring Pictographs and Bar Graphs
Interactive Video
•
Mathematics
•
6th - 10th Grade
•
Practice Problem
•
Hard
+1
Standards-aligned

Emma Peterson
Used 33+ times
FREE Resource
Standards-aligned
10 questions
Show all answers
1.
MULTIPLE CHOICE QUESTION
30 sec • 1 pt
What are the two types of graphs discussed in the video?
Histograms and Scatter plots
Pictographs and Bar graphs
Line graphs and Pie charts
Flowcharts and Venn diagrams
2.
MULTIPLE CHOICE QUESTION
30 sec • 1 pt
What does each picture in a pictograph represent?
The total amount of items
A percentage of the total items
Multiple units as defined by the key
A single unit of the item
Tags
CCSS.3.MD.B.3
3.
MULTIPLE CHOICE QUESTION
30 sec • 1 pt
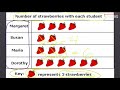
In the pictograph example, what does one strawberry picture represent?
One strawberry
Two strawberries
Three strawberries
Four strawberries
Tags
CCSS.2.MD.D.10
4.
MULTIPLE CHOICE QUESTION
30 sec • 1 pt
How many strawberries does Susan have according to the pictograph?
Two
Four
Six
Eight
Tags
CCSS.1.MD.C.4
5.
MULTIPLE CHOICE QUESTION
30 sec • 1 pt
What does the key in a pictograph help to understand?
The categories of data
The total number of items
The value each picture represents
The title of the pictograph
Tags
CCSS.2.MD.D.10
6.
MULTIPLE CHOICE QUESTION
30 sec • 1 pt
Which of the following is NOT a component of a pictograph?
Bars
Title
Key
List of items
Tags
CCSS.2.MD.D.10
7.
MULTIPLE CHOICE QUESTION
30 sec • 1 pt
What is the main difference between a pictograph and a bar graph?
Pictographs show data with pictures; bar graphs use bars to represent data
Pictographs use bars; bar graphs use pictures
Pictographs can only show quantities; bar graphs can show any data
Pictographs use pictures; bar graphs use lines
Tags
CCSS.2.MD.D.10
Access all questions and much more by creating a free account
Create resources
Host any resource
Get auto-graded reports
Continue with Google

Continue with Email
Continue with Microsoft
or continue with

%20(1).png)
Apple
Others
Already have an account?
