- Resource Library
- Math
- Probability And Statistics
- Bivariate Data
- Interpreting Two Way Tables And Bivariate Data
Interpreting Two-Way Tables and Bivariate Data
Interactive Video
•
Mathematics
•
6th - 10th Grade
•
Practice Problem
•
Hard
+4
Standards-aligned

Liam Anderson
Used 1+ times
FREE Resource
Standards-aligned
10 questions
Show all answers
1.
MULTIPLE CHOICE QUESTION
30 sec • 1 pt
What is the primary purpose of using a two-way table?
To calculate the mean and median of a dataset
To display two categories of data collected from the same source
To compare three or more variables
To display data collected from different sources
Tags
CCSS.8.SP.A.4
2.
MULTIPLE CHOICE QUESTION
30 sec • 1 pt
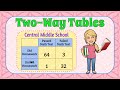
How many students did their homework and passed the math test?
1 student
32 students
64 students
3 students
Tags
CCSS.8.SP.A.4
3.
MULTIPLE CHOICE QUESTION
30 sec • 1 pt
What does the marginal frequency represent in a two-way table?
The ratio of two different outcomes
The probability of an event occurring
The combined outcomes of two variables
The total outcomes of a single variable
Tags
CCSS.8.SP.A.4
4.
MULTIPLE CHOICE QUESTION
30 sec • 1 pt
What percentage of students who did no homework passed the math test?
1%
32%
64%
3%
Tags
CCSS.8.SP.A.4
5.
MULTIPLE CHOICE QUESTION
30 sec • 1 pt
What is the ratio of students who did no homework and passed to those who failed?
3 to 64
64 to 3
32 to 1
1 to 32
Tags
CCSS.6.RP.A.3B
6.
MULTIPLE CHOICE QUESTION
30 sec • 1 pt
Does the data support the belief that doing homework is associated with passing the math test?
No, because the data is inconclusive
Yes, because 3% of students who did homework failed
No, because 1% of students who did no homework passed
Yes, because 64% of students who did homework passed
Tags
CCSS.8.SP.A.4
7.
MULTIPLE CHOICE QUESTION
30 sec • 1 pt
Based on the new dataset, how many people prefer to snowboard?
120 people
106 people
144 people
130 people
Tags
CCSS.3.MD.B.3
Access all questions and much more by creating a free account
Create resources
Host any resource
Get auto-graded reports
Continue with Google

Continue with Email
Continue with Classlink
Continue with Clever
or continue with
Microsoft
%20(1).png)
Apple
Others
Already have an account?
Popular Resources on Wayground

8 questions
Spartan Way - Classroom Responsible
Quiz
•
9th - 12th Grade
15 questions
Fractions on a Number Line
Quiz
•
3rd Grade
14 questions
Boundaries & Healthy Relationships
Lesson
•
6th - 8th Grade
20 questions
Equivalent Fractions
Quiz
•
3rd Grade
3 questions
Integrity and Your Health
Lesson
•
6th - 8th Grade
25 questions
Multiplication Facts
Quiz
•
5th Grade
9 questions
FOREST Perception
Lesson
•
KG
20 questions
Main Idea and Details
Quiz
•
5th Grade
Discover more resources for Mathematics
12 questions
Review: Surface Area of Rectangular and Triangular Prisms
Quiz
•
6th Grade
20 questions
Scatter Plots and Line of Best Fit
Quiz
•
8th Grade
36 questions
6th Grade Math STAAR Review
Quiz
•
6th Grade
12 questions
8th U6 L4 - Fitting a Line to Data
Quiz
•
8th Grade
14 questions
Volume of rectangular prisms
Quiz
•
7th Grade
25 questions
Scatter Plots and Line of Best Fit
Quiz
•
8th Grade
14 questions
finding slope from a graph
Quiz
•
8th Grade
20 questions
Graphing Inequalities on a Number Line
Quiz
•
6th - 9th Grade