- Resource Library
- Math
- Data And Graphing
- Scatter Plot Association
- Exploring Scatter Plots And Their Associations
Exploring Scatter Plots and Their Associations
Interactive Video
•
Mathematics
•
6th - 10th Grade
•
Practice Problem
•
Hard
+2
Standards-aligned

Aiden Montgomery
FREE Resource
Standards-aligned
Read more
10 questions
Show all answers
1.
MULTIPLE CHOICE QUESTION
30 sec • 1 pt
What do scatter plots primarily display?
Categorical data with one variable
Numerical data with two variables
Textual analysis data
Historical data over time
Tags
CCSS.8.SP.A.1
2.
MULTIPLE CHOICE QUESTION
30 sec • 1 pt
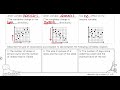
How many shoppers did Zara survey according to the scatter plot?
20
16
12
10
Tags
CCSS.HSF.IF.B.4
3.
MULTIPLE CHOICE QUESTION
30 sec • 1 pt
What type of association is observed when both variables increase together?
Positive association
No association
Linear association
Negative association
Tags
CCSS.HSF-LE.A.1B
4.
MULTIPLE CHOICE QUESTION
30 sec • 1 pt
What does a negative association in a scatter plot indicate?
As one variable increases, the other also increases
As one variable increases, the other decreases
No change in variables
Both variables decrease together
Tags
CCSS.HSS.ID.B.5
5.
MULTIPLE CHOICE QUESTION
30 sec • 1 pt
What association is suggested by a scatter plot where as one variable increases, the other decreases?
Linear association
No association
Negative association
Positive association
6.
MULTIPLE CHOICE QUESTION
30 sec • 1 pt
In the context of scatter plots, what does no association between variables imply?
One variable increases as the other decreases
There is a random pattern between variables
The variables decrease together
The variables increase together
Tags
CCSS.HSS.ID.B.5
7.
MULTIPLE CHOICE QUESTION
30 sec • 1 pt
What signifies a strong association in a scatter plot?
Data points form a perfect straight line
Data points are closely clustered together
Data points are randomly placed
Data points are widely spread out
Tags
CCSS.HSS.ID.B.5
Access all questions and much more by creating a free account
Create resources
Host any resource
Get auto-graded reports
Continue with Google

Continue with Email
Continue with Microsoft
or continue with

%20(1).png)
Apple
Others
Already have an account?
