Interpreting Line Graphs Effectively
Interactive Video
•
Mathematics
•
1st - 5th Grade
•
Practice Problem
•
Easy
+2
Standards-aligned

Ethan Morris
Used 24+ times
FREE Resource
Standards-aligned
Read more
10 questions
Show all answers
1.
MULTIPLE CHOICE QUESTION
30 sec • 1 pt
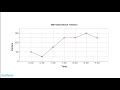
What does the line graph initially describe?
Temperature changes at Mermaid Beach
Visitor numbers at Mermaid Beach in the morning
Types of fish found at Mermaid Beach
Tide levels at Mermaid Beach
Tags
CCSS.HSF.IF.B.4
2.
MULTIPLE CHOICE QUESTION
30 sec • 1 pt
At what time did Mermaid Beach have the most visitors?
8:30 AM
7:00 AM
9:00 AM
6:30 AM
Tags
CCSS.5.G.A.2
3.
MULTIPLE CHOICE QUESTION
30 sec • 1 pt
What was the visitor count at Mermaid Beach at its lowest?
75 visitors
100 visitors
50 visitors
25 visitors
Tags
CCSS.HSN.VM.C.6
4.
MULTIPLE CHOICE QUESTION
30 sec • 1 pt
What time had the fewest visitors at Mermaid Beach?
6:30 AM
9:00 AM
7:00 AM
8:30 AM
Tags
CCSS.5.G.A.2
5.
MULTIPLE CHOICE QUESTION
30 sec • 1 pt
How many visitors were present at Mermaid Beach at 7:00 AM?
100 visitors
75 visitors
50 visitors
25 visitors
6.
MULTIPLE CHOICE QUESTION
30 sec • 1 pt
What was the increase in the number of visitors from 7:00 AM to 7:30 AM?
25 visitors
50 visitors
100 visitors
75 visitors
Tags
CCSS.4.MD.B.4
7.
MULTIPLE CHOICE QUESTION
30 sec • 1 pt
How many visitors were there at Mermaid Beach at 7:30 AM?
75 visitors
50 visitors
125 visitors
100 visitors
Access all questions and much more by creating a free account
Create resources
Host any resource
Get auto-graded reports
Continue with Google

Continue with Email
Continue with Microsoft
or continue with

%20(1).png)
Apple
Others
Already have an account?
