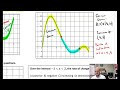
Understanding Concavity and Rate of Change
Interactive Video
•
Mathematics, Education
•
9th - 12th Grade
•
Practice Problem
•
Hard

Emma Peterson
FREE Resource
Read more
10 questions
Show all answers
1.
MULTIPLE CHOICE QUESTION
30 sec • 1 pt
What is the primary focus of this lesson?
Understanding concavity
Learning about derivatives
Exploring integrals
Studying limits
2.
MULTIPLE CHOICE QUESTION
30 sec • 1 pt
Which of the following best describes the rate of change?
The change in output for equal intervals of input
The area under a curve
The amount of money James earns per hour
The slope of a tangent line
3.
MULTIPLE CHOICE QUESTION
30 sec • 1 pt
If a function is concave up, what can be said about its rate of change?
The rate of change is constant
The rate of change is zero
The rate of change is decreasing
The rate of change is increasing
4.
MULTIPLE CHOICE QUESTION
30 sec • 1 pt
What does a concave down graph indicate about the rate of change?
The rate of change is constant
The rate of change is decreasing
The rate of change is increasing
The rate of change is zero
5.
MULTIPLE CHOICE QUESTION
30 sec • 1 pt
What is a point of inflection?
A point where the rate of change is zero
A point where the concavity changes
A point where the graph is concave down
A point where the graph is concave up
6.
MULTIPLE CHOICE QUESTION
30 sec • 1 pt
In the interval from 0 to 2, if the rate of change is positive and increasing, how would the graph look?
A straight line
A downward curve
A horizontal line
An upward curve
7.
MULTIPLE CHOICE QUESTION
30 sec • 1 pt
During which interval is the graph concave down and the rate of change decreasing?
5 to 6
0 to 2
3 to 5
2 to 3
Access all questions and much more by creating a free account
Create resources
Host any resource
Get auto-graded reports
Continue with Google

Continue with Email
Continue with Classlink
Continue with Clever
or continue with
Microsoft
%20(1).png)
Apple
Others
Already have an account?
