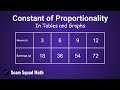
Identifying the Constant of Proportionality in Tables and Graphs
Interactive Video
•
Mathematics
•
6th - 10th Grade
•
Practice Problem
•
Medium
+1
Standards-aligned

Olivia Brooks
Used 8+ times
FREE Resource
Standards-aligned
10 questions
Show all answers
1.
MULTIPLE CHOICE QUESTION
30 sec • 1 pt
What is the first step in identifying the constant of proportionality in a table?
Multiply the y and x values
Add the y and x values together
Divide the y value by the x value
Subtract the x value from the y value
Tags
CCSS.7.RP.A.2B
2.
MULTIPLE CHOICE QUESTION
30 sec • 1 pt
What does COP stand for?
Constant of Proportion
Constant of Proportionality
Coefficient of Proportionality
Coefficient of Proportion
Tags
CCSS.7.RP.A.2B
3.
MULTIPLE CHOICE QUESTION
30 sec • 1 pt
What is the next step after creating ratios in the process of finding the COP in a table?
Subtract the ratios
Add the ratios together
Divide to find the COP
Multiply the ratios
4.
MULTIPLE CHOICE QUESTION
30 sec • 1 pt
What is the significance of creating ratios in identifying COP?
To calculate the sum of y and x values
To establish the equality of the ratios indicating proportionality
To find the difference between y and x values
To determine the slope of the line
Tags
CCSS.8.EE.B.5
5.
MULTIPLE CHOICE QUESTION
30 sec • 1 pt
How do you verify the constant of proportionality in a table?
By checking if all ratios equal 1
By comparing the ratios to a standard value
By confirming all ratios are the same
By ensuring all ratios are different
Tags
CCSS.7.RP.A.2B
6.
MULTIPLE CHOICE QUESTION
30 sec • 1 pt
What was the COP in the provided table example?
47
6
5
50
Tags
CCSS.7.RP.A.2B
7.
MULTIPLE CHOICE QUESTION
30 sec • 1 pt
In the context of graphs, what axis represents the y-value?
None of the above
Diagonal
Vertical
Horizontal
Tags
CCSS.5.OA.B.3
Access all questions and much more by creating a free account
Create resources
Host any resource
Get auto-graded reports
Continue with Google

Continue with Email
Continue with Classlink
Continue with Clever
or continue with
Microsoft
%20(1).png)
Apple
Others
Already have an account?
