Analyzing Dot Plots for Percent Calculations
Interactive Video
•
Mathematics
•
6th - 10th Grade
•
Practice Problem
•
Hard
+3
Standards-aligned

Aiden Montgomery
FREE Resource
Standards-aligned
Read more
10 questions
Show all answers
1.
MULTIPLE CHOICE QUESTION
30 sec • 1 pt
What does each dot on the dot plot represent?
One adult resident at the nursing home
A group of people
Two adult residents at the nursing home
The age of the resident
Tags
CCSS.6.SP.B.4
CCSS.HSS.ID.A.1
2.
MULTIPLE CHOICE QUESTION
30 sec • 1 pt
How many adults live at the senior home according to the dot plot?
10
20
30
40
Tags
CCSS.6.SP.B.4
CCSS.HSS.ID.A.1
3.
MULTIPLE CHOICE QUESTION
30 sec • 1 pt
What age range is being considered to calculate the percentage of residents in their 70s?
70-79
60-69
80-89
90-99
Tags
CCSS.6.RP.A.3C
4.
MULTIPLE CHOICE QUESTION
30 sec • 1 pt
How many residents are in their 70s?
15
20
10
5
Tags
CCSS.HSN.VM.C.6
5.
MULTIPLE CHOICE QUESTION
30 sec • 1 pt
What is the first step in setting up a proportion to find a percentage?
Divide by the total number
Cross multiply
Multiply by 100
Identify the total and the part
6.
MULTIPLE CHOICE QUESTION
30 sec • 1 pt
What is the total number used in the proportion for calculating the percentage of residents in their 70s?
30
40
20
10
7.
MULTIPLE CHOICE QUESTION
30 sec • 1 pt
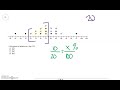
What percentage of the nursing home residents are in their 70s?
25%
50%
75%
100%
Access all questions and much more by creating a free account
Create resources
Host any resource
Get auto-graded reports
Continue with Google

Continue with Email
Continue with Microsoft
or continue with

%20(1).png)
Apple
Others
Already have an account?
