Approximating Limits Graphically
Interactive Video
•
Mathematics
•
6th - 10th Grade
•
Practice Problem
•
Hard
Standards-aligned

Lucas Foster
FREE Resource
Standards-aligned
10 questions
Show all answers
1.
MULTIPLE CHOICE QUESTION
30 sec • 1 pt
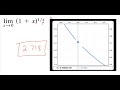
What value does the limit of (1+x)^(1/x) approach as x gets closer to 0?
Approximately 3.14
Exactly 2
Approximately 2.718
Exactly 1
Tags
CCSS.HSF-IF.C.7E
2.
MULTIPLE CHOICE QUESTION
30 sec • 1 pt
What graphical feature did the calculator show for the function (1+x)^(1/x) as x approaches 0?
An exponential curve
A straight line
A parabola
A hole in the graph
Tags
CCSS.HSF-IF.C.7D
3.
MULTIPLE CHOICE QUESTION
30 sec • 1 pt
What does the presence of a hole in a graph indicate about the function?
The function has a minimum value at that point.
The function intersects with another function.
The function has a maximum value at that point.
The function is undefined at that point.
Tags
CCSS.HSF-IF.C.7E
4.
MULTIPLE CHOICE QUESTION
30 sec • 1 pt
What is the significance of using scientific notation to represent x values when zooming in on a graph?
It indicates very large numbers.
It shows the precision of the calculator.
It simplifies the graphing process.
It represents very small numbers close to zero.
5.
MULTIPLE CHOICE QUESTION
30 sec • 1 pt
What is the estimated limit of the function (1+x)^(1/x) as x approaches 0?
0
1
pi (approximately 3.14159)
e (approximately 2.718)
6.
MULTIPLE CHOICE QUESTION
30 sec • 1 pt
Why can't we directly substitute 0 into the expression (1+x)^(1/x)?
It simplifies the expression too much.
It cancels out the x variable.
It makes the limit equal to 1.
It results in an undefined expression.
7.
MULTIPLE CHOICE QUESTION
30 sec • 1 pt
Why is it necessary to use a graphical approach to approximate some limits?
To visually confirm the limit's value.
Because algebraic techniques are always insufficient.
When direct substitution or algebraic techniques don't apply.
Graphical methods are easier to understand.
Tags
CCSS.HSF-IF.C.7E
Access all questions and much more by creating a free account
Create resources
Host any resource
Get auto-graded reports
Continue with Google

Continue with Email
Continue with Classlink
Continue with Clever
or continue with
Microsoft
%20(1).png)
Apple
Others
Already have an account?
Popular Resources on Wayground

15 questions
Fractions on a Number Line
Quiz
•
3rd Grade
20 questions
Equivalent Fractions
Quiz
•
3rd Grade
25 questions
Multiplication Facts
Quiz
•
5th Grade
22 questions
fractions
Quiz
•
3rd Grade
20 questions
Main Idea and Details
Quiz
•
5th Grade
20 questions
Context Clues
Quiz
•
6th Grade
15 questions
Equivalent Fractions
Quiz
•
4th Grade
20 questions
Figurative Language Review
Quiz
•
6th Grade
Discover more resources for Mathematics
20 questions
Exponents
Quiz
•
6th Grade
22 questions
distributive property
Quiz
•
7th Grade
15 questions
Distributive Property & Review
Quiz
•
6th Grade
20 questions
Writing Algebraic Expressions
Quiz
•
6th Grade
20 questions
Ratios/Rates and Unit Rates
Quiz
•
6th Grade
20 questions
Writing and Graphing Inequalities
Quiz
•
6th Grade
15 questions
Product of Powers Property A1 U7
Quiz
•
8th Grade
20 questions
Laws of Exponents
Quiz
•
8th Grade