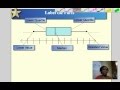
Exploring Box-and-Whisker Plots
Interactive Video
•
Mathematics
•
6th - 10th Grade
•
Practice Problem
•
Medium
+1
Standards-aligned

Amelia Wright
Used 1+ times
FREE Resource
Standards-aligned
Read more
10 questions
Show all answers
1.
MULTIPLE CHOICE QUESTION
30 sec • 1 pt
What is the primary purpose of a box and whisker plot?
To compare two different datasets
To show the distribution of a categorical dataset
To calculate the mean of a dataset
To summarize a set of data along a number line
Tags
CCSS.6.SP.B.4
CCSS.HSS.ID.A.1
2.
MULTIPLE CHOICE QUESTION
30 sec • 1 pt
What is the first step in creating a box and whisker plot?
Finding the median
Arranging the data from least to greatest
Drawing the whiskers
Identifying the quartiles
Tags
CCSS.6.SP.B.4
CCSS.HSS.ID.A.1
3.
MULTIPLE CHOICE QUESTION
30 sec • 1 pt
How is the lower quartile found in a dataset?
By finding the median of the upper half of the data
By identifying the lowest value in the dataset
By calculating the mean of the entire dataset
By finding the median of the lower half of the data
Tags
CCSS.6.SP.B.5C
4.
MULTIPLE CHOICE QUESTION
30 sec • 1 pt
How is the upper quartile of a dataset determined?
By identifying the highest value in the dataset
By calculating the mean of the dataset
By finding the median of the upper half of the dataset
By finding the median of the entire dataset
Tags
CCSS.6.SP.B.5C
5.
MULTIPLE CHOICE QUESTION
30 sec • 1 pt
What does the right whisker in a box and whisker plot represent?
The highest value in the dataset
The upper quartile
The lowest value in the dataset
The median of the dataset
Tags
CCSS.6.SP.B.4
CCSS.HSS.ID.A.1
6.
MULTIPLE CHOICE QUESTION
30 sec • 1 pt
What does the box in a box and whisker plot represent?
The range of the dataset
The total dataset
The outliers in the dataset
The middle 50% of the dataset
Tags
CCSS.6.SP.B.4
CCSS.HSS.ID.A.1
7.
MULTIPLE CHOICE QUESTION
30 sec • 1 pt
In which year was the corn yield more varied according to the box and whisker plot?
The variation cannot be determined from the plot
1999
2003
Both years had the same variation
Tags
CCSS.6.SP.B.4
CCSS.HSS.ID.A.1
Access all questions and much more by creating a free account
Create resources
Host any resource
Get auto-graded reports
Continue with Google

Continue with Email
Continue with Microsoft
or continue with

%20(1).png)
Apple
Others
Already have an account?
