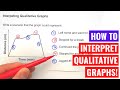
Understanding Qualitative Graphs and Trends
Interactive Video
•
Mathematics
•
6th - 8th Grade
•
Practice Problem
•
Easy
Standards-aligned

Sophia Harris
Used 14+ times
FREE Resource
Standards-aligned
Read more
10 questions
Show all answers
1.
MULTIPLE CHOICE QUESTION
30 sec • 1 pt
What is a qualitative graph primarily used for?
Calculating exact values
Displaying numerical data
Comparing statistical data
Understanding the shape and trends
Tags
CCSS.HSF.IF.B.4
2.
MULTIPLE CHOICE QUESTION
30 sec • 1 pt
In the first interval, what activity is represented by the increasing line?
Jogging
Swimming
Driving
Cycling
Tags
CCSS.HSF.IF.B.4
3.
MULTIPLE CHOICE QUESTION
30 sec • 1 pt
What does a flat line in the second interval indicate?
Constant distance
Increasing speed
Decreasing speed
Variable distance
4.
MULTIPLE CHOICE QUESTION
30 sec • 1 pt
During the third interval, what change occurs in the movement?
The speed increases
The speed decreases
The direction changes
The distance remains constant
Tags
CCSS.HSF.IF.B.4
5.
MULTIPLE CHOICE QUESTION
30 sec • 1 pt
What does the fourth interval suggest about the activity?
The person is running
The person is taking a break
The person is accelerating
The person is lost
Tags
CCSS.HSF.IF.B.4
6.
MULTIPLE CHOICE QUESTION
30 sec • 1 pt
In the fifth interval, what does the steep line indicate?
A change in direction
A constant pace
A fast return
A slow return
Tags
CCSS.8.EE.B.5
7.
MULTIPLE CHOICE QUESTION
30 sec • 1 pt
What is the significance of the steepness of a line in a qualitative graph?
It represents the graph's size
It indicates the speed of change
It determines the graph's shape
It shows the color of the graph
Tags
CCSS.8.EE.B.5
Access all questions and much more by creating a free account
Create resources
Host any resource
Get auto-graded reports
Continue with Google

Continue with Email
Continue with Microsoft
or continue with

%20(1).png)
Apple
Others
Already have an account?
