Corn and Motorcycle Sales Analysis
Interactive Video
•
Mathematics, Education
•
4th - 6th Grade
•
Practice Problem
•
Hard

Mia Campbell
FREE Resource
Read more
10 questions
Show all answers
1.
MULTIPLE CHOICE QUESTION
30 sec • 1 pt
What type of diagrams are discussed in the video?
Bar and line diagrams
Histogram and scatter diagrams
Pie and line diagrams
Scatter and pie diagrams
2.
MULTIPLE CHOICE QUESTION
30 sec • 1 pt
How many motorcycles were sold in January?
70 units
90 units
100 units
80 units
3.
MULTIPLE CHOICE QUESTION
30 sec • 1 pt
What was the decrease in motorcycle sales from January to February?
30 units
20 units
50 units
40 units
4.
MULTIPLE CHOICE QUESTION
30 sec • 1 pt
How many motorcycles were sold in March?
40 units
60 units
50 units
30 units
5.
MULTIPLE CHOICE QUESTION
30 sec • 1 pt
What was the increase in motorcycle sales from March to April?
50 units
20 units
30 units
40 units
6.
MULTIPLE CHOICE QUESTION
30 sec • 1 pt
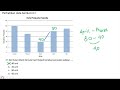
In which year did the corn harvest reach its peak?
2019
2018
2015
2016
7.
MULTIPLE CHOICE QUESTION
30 sec • 1 pt
What was the corn yield in 2019?
200 quintals
240 quintals
180 quintals
220 quintals
Access all questions and much more by creating a free account
Create resources
Host any resource
Get auto-graded reports
Continue with Google

Continue with Email
Continue with Classlink
Continue with Clever
or continue with
Microsoft
%20(1).png)
Apple
Others
Already have an account?
