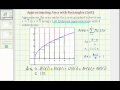
Approximating Area Under a Curve
Interactive Video
•
Mathematics
•
9th - 12th Grade
•
Practice Problem
•
Hard
Standards-aligned

Aiden Montgomery
FREE Resource
Standards-aligned
Read more
10 questions
Show all answers
1.
MULTIPLE CHOICE QUESTION
30 sec • 1 pt
What is the purpose of using rectangles to approximate the area under a curve?
To determine the slope of the curve
To estimate the area when the function is unknown
To simplify the calculation of the area
To find the exact area under the curve
Tags
CCSS.8.F.B.4
CCSS.HSF.IF.B.6
2.
MULTIPLE CHOICE QUESTION
30 sec • 1 pt
How is the width of each sub-interval (delta x) calculated?
By subtracting the total interval from the number of rectangles
By dividing the total interval by the number of rectangles
By multiplying the total interval by the number of rectangles
By adding the total interval to the number of rectangles
3.
MULTIPLE CHOICE QUESTION
30 sec • 1 pt
In a left endpoint approximation, how is the height of each rectangle determined?
Using the left side of each sub-interval
Using the average of the left and right sides
Using the midpoint of each sub-interval
Using the right side of each sub-interval
Tags
CCSS.HSF.IF.A.2
4.
MULTIPLE CHOICE QUESTION
30 sec • 1 pt
What is the function notation used to express the area of a rectangle in this approximation?
f(x) times delta y
f(x) times delta x
f(c sub i) times delta x
f(c sub i) times delta y
5.
MULTIPLE CHOICE QUESTION
30 sec • 1 pt
Why is it necessary to approximate function values from the graph?
The function is not provided
The function is irrelevant
The function is too complex
The graph is more accurate
6.
MULTIPLE CHOICE QUESTION
30 sec • 1 pt
What is the approximate area under the curve using the five rectangles?
12.5 square units
11.5 square units
13.5 square units
10.5 square units
7.
MULTIPLE CHOICE QUESTION
30 sec • 1 pt
What does the term 'lower sum' refer to in this context?
The approximation is more than the actual area
The sum of the smallest rectangles
The sum of the largest rectangles
The approximation is less than the actual area
Access all questions and much more by creating a free account
Create resources
Host any resource
Get auto-graded reports
Continue with Google

Continue with Email
Continue with Classlink
Continue with Clever
or continue with
Microsoft
%20(1).png)
Apple
Others
Already have an account?
Popular Resources on Wayground

8 questions
Spartan Way - Classroom Responsible
Quiz
•
9th - 12th Grade
15 questions
Fractions on a Number Line
Quiz
•
3rd Grade
14 questions
Boundaries & Healthy Relationships
Lesson
•
6th - 8th Grade
20 questions
Equivalent Fractions
Quiz
•
3rd Grade
3 questions
Integrity and Your Health
Lesson
•
6th - 8th Grade
25 questions
Multiplication Facts
Quiz
•
5th Grade
9 questions
FOREST Perception
Lesson
•
KG
20 questions
Main Idea and Details
Quiz
•
5th Grade
Discover more resources for Mathematics
20 questions
Graphing Inequalities on a Number Line
Quiz
•
6th - 9th Grade
11 questions
Adding and Subtracting Polynomials
Quiz
•
9th Grade
20 questions
Box and Whisker Plots
Quiz
•
9th Grade
18 questions
Exponential Growth and Decay
Quiz
•
9th Grade
25 questions
Logos
Quiz
•
12th Grade
12 questions
Equation of a Circle
Lesson
•
10th Grade
12 questions
Exponential Growth and Decay
Quiz
•
9th Grade
14 questions
Making Inferences From Samples
Quiz
•
7th - 12th Grade