Understanding Z-Scores and Probability
Interactive Video
•
Mathematics, Science
•
9th - 12th Grade
•
Practice Problem
•
Hard

Jackson Turner
FREE Resource
Read more
10 questions
Show all answers
1.
MULTIPLE CHOICE QUESTION
30 sec • 1 pt
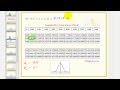
What is the purpose of using tables in relation to Z-scores?
To identify outliers in the data
To find the mean of a data set
To calculate the standard deviation
To determine probabilities related to Z-scores
2.
MULTIPLE CHOICE QUESTION
30 sec • 1 pt
Which table provides the area to the left of a given Z-score?
Standard deviation table
Cumulative table
Zero to Z table
Mean table
3.
MULTIPLE CHOICE QUESTION
30 sec • 1 pt
How do you find the probability of a Z-score being greater than a given value?
Multiply the cumulative probability by 2
Divide the cumulative probability by 2
Add the cumulative probability to 1
Subtract the cumulative probability from 1
4.
MULTIPLE CHOICE QUESTION
30 sec • 1 pt
In the example, what is the probability of a Z-score being less than 1.4?
0.9192
0.6736
0.0808
0.5000
5.
MULTIPLE CHOICE QUESTION
30 sec • 1 pt
What is the probability of a Z-score being greater than 1.4?
0.5000
0.9192
0.6736
0.0808
6.
MULTIPLE CHOICE QUESTION
30 sec • 1 pt
How do you find the probability of a Z-score being between two values?
Use the cumulative table for both values
Use the zero to Z table for both values and add the areas
Multiply the probabilities of both Z-scores
Subtract the smaller Z-score from the larger one
7.
MULTIPLE CHOICE QUESTION
30 sec • 1 pt
What is the probability of a Z-score being between -0.5 and 2.1?
0.9192
0.0808
0.5000
0.6736
Access all questions and much more by creating a free account
Create resources
Host any resource
Get auto-graded reports
Continue with Google

Continue with Email
Continue with Classlink
Continue with Clever
or continue with
Microsoft
%20(1).png)
Apple
Others
Already have an account?
