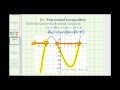
Polynomial Inequalities and Graphical Solutions
Interactive Video
•
Mathematics
•
9th - 12th Grade
•
Practice Problem
•
Hard
Standards-aligned

Emma Peterson
FREE Resource
Standards-aligned
Read more
10 questions
Show all answers
1.
MULTIPLE CHOICE QUESTION
30 sec • 1 pt
What is the primary goal when solving a polynomial inequality?
To find x values where the product is greater than zero
To find x values where the product is less than zero
To find x values where the product is greater than or equal to zero
To find x values where the product is equal to zero
2.
MULTIPLE CHOICE QUESTION
30 sec • 1 pt
What is the first step in solving the polynomial inequality?
Graphing the inequality
Testing random x values
Determining x values that make the product zero
Using interval notation
Tags
CCSS.6.EE.B.8
3.
MULTIPLE CHOICE QUESTION
30 sec • 1 pt
Why are open points used on the number line for this inequality?
Because the inequality is less than zero
Because the inequality is less than or equal to zero
Because the inequality is greater than zero
Because the inequality is greater than or equal to zero
4.
MULTIPLE CHOICE QUESTION
30 sec • 1 pt
Which interval is part of the solution when testing x = -5?
Interval from 5 to positive infinity
Interval from -4 to -1
Interval from -1 to 5
Interval from negative infinity to -4
5.
MULTIPLE CHOICE QUESTION
30 sec • 1 pt
What is the result when testing x = 0?
The interval is part of the solution
The product is equal to zero
The product is greater than zero
The interval is not part of the solution
6.
MULTIPLE CHOICE QUESTION
30 sec • 1 pt
How can the solution be expressed?
Using only a graph
Using interval notation, inequalities, or a graph
Using only interval notation
Using only inequalities
Tags
CCSS.HSF-IF.C.7A
7.
MULTIPLE CHOICE QUESTION
30 sec • 1 pt
What does it mean when the function is below the x-axis?
The function values are undefined
The function values are positive
The function values are zero
The function values are negative
Access all questions and much more by creating a free account
Create resources
Host any resource
Get auto-graded reports
Continue with Google

Continue with Email
Continue with Classlink
Continue with Clever
or continue with
Microsoft
%20(1).png)
Apple
Others
Already have an account?
