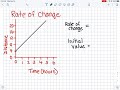
Analyzing Rate of Change and Initial Value in Graphs
Interactive Video
•
Mathematics
•
6th - 7th Grade
•
Practice Problem
•
Hard

Patricia Brown
FREE Resource
Read more
10 questions
Show all answers
1.
MULTIPLE CHOICE QUESTION
30 sec • 1 pt
What does the graph in the video represent?
Speed and time
Time and acceleration
Distance and speed
Distance and time
2.
MULTIPLE CHOICE QUESTION
30 sec • 1 pt
How do you determine the rise when calculating the rate of change?
By subtracting the x-values of two points
By adding the y-values of two points
By adding the x-values of two points
By subtracting the y-values of two points
3.
MULTIPLE CHOICE QUESTION
30 sec • 1 pt
What is the formula for calculating the rate of change?
Sum of rise and run
Run divided by rise
Difference between rise and run
Rise divided by run
4.
MULTIPLE CHOICE QUESTION
30 sec • 1 pt
What does a positive slope indicate about the rate of change?
The rate of change is positive
The rate of change is negative
The rate of change is constant
The rate of change is zero
5.
MULTIPLE CHOICE QUESTION
30 sec • 1 pt
Where do you find the initial value on a graph?
At the intersection of the x-axis and the line
At the highest point on the graph
At the intersection of the y-axis and the line
At the lowest point on the graph
6.
MULTIPLE CHOICE QUESTION
30 sec • 1 pt
What is the initial value in the video example?
0 kilometers
4 kilometers
12 kilometers
8 kilometers
7.
MULTIPLE CHOICE QUESTION
30 sec • 1 pt
How is the rate of change determined from a table of values?
By finding the difference in x-values
By finding the ratio of the rise to the run
By finding the sum of the rise and run
By finding the difference in y-values
Access all questions and much more by creating a free account
Create resources
Host any resource
Get auto-graded reports
Continue with Google

Continue with Email
Continue with Classlink
Continue with Clever
or continue with
Microsoft
%20(1).png)
Apple
Others
Already have an account?
