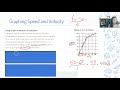
Graphing Speed and Velocity: Analyzing Motion Through Time
Interactive Video
•
Mathematics, Physics, Science
•
9th - 10th Grade
•
Practice Problem
•
Hard

Patricia Brown
FREE Resource
Read more
10 questions
Show all answers
1.
MULTIPLE CHOICE QUESTION
30 sec • 1 pt
What should you check first when looking at a graph to determine if it's a speed or velocity graph?
The color of the graph
The labels on the x-axis
The labels on the y-axis
The title of the graph
2.
MULTIPLE CHOICE QUESTION
30 sec • 1 pt
Which formula is used to calculate acceleration from a graph?
Final velocity minus initial velocity divided by time
Distance divided by time
Initial velocity plus final velocity
Speed multiplied by time
3.
MULTIPLE CHOICE QUESTION
30 sec • 1 pt
In the example of the first second of the race, what was the final velocity?
100 meters per second
50 meters per second
25 meters per second
0 meters per second
4.
MULTIPLE CHOICE QUESTION
30 sec • 1 pt
How do you calculate the average speed of the entire race if the final velocity is 150 m/s and the race lasts 5 seconds?
150 plus 5
150 minus 5
150 multiplied by 5
150 divided by 5
5.
MULTIPLE CHOICE QUESTION
30 sec • 1 pt
What is the average speed between 2 and 4 seconds if the final velocity is 137 m/s and the initial velocity is 100 m/s?
18.5 meters per second squared
75 meters per second squared
37 meters per second squared
50 meters per second squared
6.
MULTIPLE CHOICE QUESTION
30 sec • 1 pt
What does a positive average speed indicate about the motion of an object?
The object is stationary
The object is speeding up
The object is slowing down
The object is moving at a constant speed
7.
MULTIPLE CHOICE QUESTION
30 sec • 1 pt
What should you do if you want to calculate the average acceleration for a different time interval on a graph?
Use the same formula and apply it to the new interval
Change the graph type
Use a different formula
Ignore the graph and calculate manually
Access all questions and much more by creating a free account
Create resources
Host any resource
Get auto-graded reports
Continue with Google

Continue with Email
Continue with Microsoft
or continue with

%20(1).png)
Apple
Others
Already have an account?
