Analyzing Average Rate of Change Through Graphs and Tables
Interactive Video
•
Mathematics
•
9th - 10th Grade
•
Practice Problem
•
Hard

Patricia Brown
FREE Resource
Read more
10 questions
Show all answers
1.
MULTIPLE CHOICE QUESTION
30 sec • 1 pt
What is the average rate of change primarily concerned with when analyzing graphs?
The area under the graph
The maximum value of the graph
The slope of the line connecting two points
The curvature of the graph
2.
MULTIPLE CHOICE QUESTION
30 sec • 1 pt
Which symbol is used to denote change in values when calculating slope?
Sigma (Σ)
Pi (π)
Delta (Δ)
Theta (Θ)
3.
MULTIPLE CHOICE QUESTION
30 sec • 1 pt
In function notation, what does f(x2) - f(x1) represent?
The change in y values
The change in x values
The average of x values
The average of y values
4.
MULTIPLE CHOICE QUESTION
30 sec • 1 pt
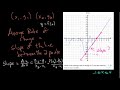
What is the average rate of change over the interval from x = -1 to x = 4 in the example provided?
5/7
7/5
1/2
2/1
5.
MULTIPLE CHOICE QUESTION
30 sec • 1 pt
How is the average rate of change interpreted in terms of movement along the x and y axes?
For every 7 units up, it goes over 5 units
For every 5 units up, it goes over 7 units
For every 5 units over, it goes up 7 units
For every 7 units over, it goes up 5 units
6.
MULTIPLE CHOICE QUESTION
30 sec • 1 pt
What does the average rate of change fail to describe about a function?
The general direction of the function
The exact rate of change at a specific point
The average value of the function
The endpoints of the function
7.
MULTIPLE CHOICE QUESTION
30 sec • 1 pt
What mathematical concept is needed to find the exact rate of change at a specific point?
Algebra
Trigonometry
Geometry
Calculus
Access all questions and much more by creating a free account
Create resources
Host any resource
Get auto-graded reports
Continue with Google

Continue with Email
Continue with Classlink
Continue with Clever
or continue with
Microsoft
%20(1).png)
Apple
Others
Already have an account?
