Making Predictions with Best Fit Equations in Data Analysis
Interactive Video
•
Mathematics, Science, Other
•
9th - 10th Grade
•
Practice Problem
•
Hard

Patricia Brown
FREE Resource
Read more
10 questions
Show all answers
1.
MULTIPLE CHOICE QUESTION
30 sec • 1 pt
What is the primary purpose of using best fit equations?
To determine the exact values of data points
To make predictions about other sample values
To visualize data in a scatter plot
To create complex mathematical models
2.
MULTIPLE CHOICE QUESTION
30 sec • 1 pt
What does interpolation involve?
Using the best fit equation to predict within the observed data range
Making predictions outside the observed data range
Ignoring the observed data points
Creating a new data set from existing data
3.
MULTIPLE CHOICE QUESTION
30 sec • 1 pt
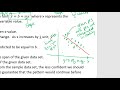
In the context of the video, what do the green points on the scatter plot represent?
Hypothetical data points
Actual observed data points
Randomly generated data points
Predicted data points
4.
MULTIPLE CHOICE QUESTION
30 sec • 1 pt
What does the red line in the scatter plot signify?
A random line drawn for reference
The average of all data points
The equation of best fit
The boundary of the data set
5.
MULTIPLE CHOICE QUESTION
30 sec • 1 pt
What is the significance of the highest and lowest x and y values in interpolation?
They are ignored in predictions
They create a boundary for interpolation
They are used to calculate the mean
They define the range for extrapolation
6.
MULTIPLE CHOICE QUESTION
30 sec • 1 pt
What is the key difference between interpolation and extrapolation?
Both are used interchangeably
Interpolation uses observed data, extrapolation does not
Extrapolation is more accurate than interpolation
Interpolation predicts within the data range, extrapolation predicts beyond it
7.
MULTIPLE CHOICE QUESTION
30 sec • 1 pt
When is extrapolation used?
When no data is available
When predicting within the observed data range
When data is perfectly linear
When predicting beyond the observed data range
Access all questions and much more by creating a free account
Create resources
Host any resource
Get auto-graded reports
Continue with Google

Continue with Email
Continue with Classlink
Continue with Clever
or continue with
Microsoft
%20(1).png)
Apple
Others
Already have an account?
