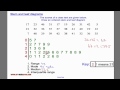
Decoding Stem And Leaf Diagrams For Data Analysis
Interactive Video
•
Mathematics, Science, Other
•
9th - 10th Grade
•
Practice Problem
•
Hard

Patricia Brown
FREE Resource
Read more
10 questions
Show all answers
1.
MULTIPLE CHOICE QUESTION
30 sec • 1 pt
What is the primary purpose of a stem and leaf diagram?
To find the standard deviation
To visually represent a data set
To calculate the mean of a data set
To determine the probability of an event
2.
MULTIPLE CHOICE QUESTION
30 sec • 1 pt
When creating a stem and leaf diagram, what does the 'stem' represent?
The decimal part of the numbers
The tens or higher place values
The sum of all data points
The units place
3.
MULTIPLE CHOICE QUESTION
30 sec • 1 pt
What is the first step in creating a stem and leaf diagram?
Calculating the mean
Deciding on a key
Determining the range
Finding the mode
4.
MULTIPLE CHOICE QUESTION
30 sec • 1 pt
How do you determine the range from a stem and leaf diagram?
Subtract the smallest value from the largest value
Add the smallest and largest values
Multiply the smallest value by the largest value
Divide the largest value by the smallest value
5.
MULTIPLE CHOICE QUESTION
30 sec • 1 pt
What is the mode in a data set?
The difference between the highest and lowest values
The most frequently occurring data point
The middle value of the data set
The average of all data points
6.
MULTIPLE CHOICE QUESTION
30 sec • 1 pt
How is the median determined in a stem and leaf diagram?
By subtracting the smallest value from the largest
By locating the middle data point in an ordered list
By identifying the most frequent data point
By finding the average of all data points
7.
MULTIPLE CHOICE QUESTION
30 sec • 1 pt
What does the interquartile range represent?
The sum of the upper and lower quartiles
The average of the upper and lower quartiles
The range of the entire data set
The difference between the upper and lower quartiles
Access all questions and much more by creating a free account
Create resources
Host any resource
Get auto-graded reports
Continue with Google

Continue with Email
Continue with Classlink
Continue with Clever
or continue with
Microsoft
%20(1).png)
Apple
Others
Already have an account?
Similar Resources on Wayground
Popular Resources on Wayground

15 questions
Fractions on a Number Line
Quiz
•
3rd Grade
20 questions
Equivalent Fractions
Quiz
•
3rd Grade
25 questions
Multiplication Facts
Quiz
•
5th Grade
54 questions
Analyzing Line Graphs & Tables
Quiz
•
4th Grade
22 questions
fractions
Quiz
•
3rd Grade
20 questions
Main Idea and Details
Quiz
•
5th Grade
20 questions
Context Clues
Quiz
•
6th Grade
15 questions
Equivalent Fractions
Quiz
•
4th Grade
Discover more resources for Mathematics
20 questions
Graphing Inequalities on a Number Line
Quiz
•
6th - 9th Grade
18 questions
SAT Prep: Ratios, Proportions, & Percents
Quiz
•
9th - 10th Grade
12 questions
Exponential Growth and Decay
Quiz
•
9th Grade
12 questions
Parallel Lines Cut by a Transversal
Quiz
•
10th Grade
12 questions
Add and Subtract Polynomials
Quiz
•
9th - 12th Grade
15 questions
Combine Like Terms and Distributive Property
Quiz
•
8th - 9th Grade
20 questions
Function or Not a Function
Quiz
•
8th - 9th Grade
10 questions
Elijah McCoy: Innovations and Impact in Black History
Interactive video
•
6th - 10th Grade