Analyzing Motion Through Graphs and Data from Mobile Tracking Apps
Interactive Video
•
Mathematics, Physics, Science
•
9th - 10th Grade
•
Practice Problem
•
Hard

Patricia Brown
FREE Resource
Read more
10 questions
Show all answers
1.
MULTIPLE CHOICE QUESTION
30 sec • 1 pt
What is the main purpose of using mobile apps like Strava in the context of the video?
To record video footage
To compete with friends
To collect data for analyzing motion
To track the number of calories burned
2.
MULTIPLE CHOICE QUESTION
30 sec • 1 pt
What type of graph is primarily used to visualize the data collected by mobile apps in the video?
Histogram
Speed-time graph
Pie chart
Bar graph
3.
MULTIPLE CHOICE QUESTION
30 sec • 1 pt
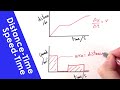
What does a distance-time graph primarily show?
The speed of an object
The direction of motion
The acceleration of an object
How distance changes over time
4.
MULTIPLE CHOICE QUESTION
30 sec • 1 pt
In a distance-time graph, what does the gradient represent?
Acceleration
Time
Speed
Distance
5.
MULTIPLE CHOICE QUESTION
30 sec • 1 pt
Why must the speed in a speed-time graph always be a positive value?
Because speed is a scalar and only has magnitude
Because speed is a vector quantity
Because speed is measured in meters per second
Because speed can be negative
6.
MULTIPLE CHOICE QUESTION
30 sec • 1 pt
What does a zero gradient in a speed-time graph indicate?
The object is accelerating
The object is moving at a constant speed
The object is stationary
The object is moving backward
7.
MULTIPLE CHOICE QUESTION
30 sec • 1 pt
What is the relationship between the gradient of a distance-time graph and a speed-time graph?
The gradient of a speed-time graph is the time
The gradient of a distance-time graph is the speed
The gradient of a speed-time graph is the distance
The gradient of a distance-time graph is the acceleration
Access all questions and much more by creating a free account
Create resources
Host any resource
Get auto-graded reports
Continue with Google

Continue with Email
Continue with Classlink
Continue with Clever
or continue with
Microsoft
%20(1).png)
Apple
Others
Already have an account?
Popular Resources on Wayground

15 questions
Fractions on a Number Line
Quiz
•
3rd Grade
20 questions
Equivalent Fractions
Quiz
•
3rd Grade
25 questions
Multiplication Facts
Quiz
•
5th Grade
29 questions
Alg. 1 Section 5.1 Coordinate Plane
Quiz
•
9th Grade
22 questions
fractions
Quiz
•
3rd Grade
11 questions
FOREST Effective communication
Lesson
•
KG
20 questions
Main Idea and Details
Quiz
•
5th Grade
20 questions
Context Clues
Quiz
•
6th Grade
Discover more resources for Mathematics
29 questions
Alg. 1 Section 5.1 Coordinate Plane
Quiz
•
9th Grade
20 questions
Graphing Inequalities on a Number Line
Quiz
•
6th - 9th Grade
20 questions
Box and Whisker Plots
Quiz
•
9th Grade
18 questions
Exponential Growth and Decay
Quiz
•
9th Grade
20 questions
Function or Not a Function
Quiz
•
8th - 9th Grade
20 questions
SSS/SAS
Quiz
•
9th - 12th Grade
14 questions
Making Inferences From Samples
Quiz
•
7th - 12th Grade
23 questions
CCG - CH8 Polygon angles and area Review
Quiz
•
9th - 12th Grade