Graphical Relationships in Motion
Interactive Video
•
Mathematics, Physics, Science
•
9th - 10th Grade
•
Hard

Patricia Brown
FREE Resource
Read more
10 questions
Show all answers
1.
MULTIPLE CHOICE QUESTION
30 sec • 1 pt
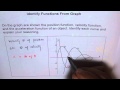
What are the three functions shown on the graph?
Energy, Power, and Work
Height, Time, and Mass
Distance, Speed, and Force
Position, Velocity, and Acceleration
2.
MULTIPLE CHOICE QUESTION
30 sec • 1 pt
How is velocity related to position?
Velocity is the product of position and acceleration
Velocity is the difference between position and acceleration
Velocity is the sum of position and time
Velocity is the rate of change of position
3.
MULTIPLE CHOICE QUESTION
30 sec • 1 pt
What does a tangent line with a slope of zero indicate on a graph?
A point of minimum acceleration
A constant rate of change
A point of maximum velocity
A turning point
4.
MULTIPLE CHOICE QUESTION
30 sec • 1 pt
Which graph represents the rate of change of the position function?
Graph D
Graph C
Graph B
Graph A
5.
MULTIPLE CHOICE QUESTION
30 sec • 1 pt
If graph C represents velocity, what does graph A represent?
Distance
Position
Acceleration
Time
6.
MULTIPLE CHOICE QUESTION
30 sec • 1 pt
What is the relationship between acceleration and velocity?
Acceleration is the product of velocity and position
Acceleration is the difference between velocity and position
Acceleration is the sum of velocity and time
Acceleration is the rate of change of velocity
7.
MULTIPLE CHOICE QUESTION
30 sec • 1 pt
Which graph is identified as representing position?
Graph D
Graph C
Graph B
Graph A
Create a free account and access millions of resources
Similar Resources on Wayground

11 questions
Effects of Drag Force on Motion
Interactive video
•
9th - 10th Grade
8 questions
MATHS - Graphs - Velocity-Time Graphs
Interactive video
•
9th - 10th Grade
6 questions
GCSE Physics - Velocity Time Graphs #54
Interactive video
•
9th - 10th Grade
11 questions
Analyzing Velocity and Displacement Graphs
Interactive video
•
9th - 10th Grade
11 questions
Understanding Motion Graphs and Acceleration
Interactive video
•
9th - 10th Grade
11 questions
Understanding Acceleration Concepts
Interactive video
•
9th - 10th Grade
11 questions
Understanding Velocity-Time Graphs and Newton's Laws
Interactive video
•
9th - 10th Grade
8 questions
GCSE Physics - Terminal Velocity #55
Interactive video
•
9th - 10th Grade
Popular Resources on Wayground
10 questions
Lab Safety Procedures and Guidelines
Interactive video
•
6th - 10th Grade
10 questions
Nouns, nouns, nouns
Quiz
•
3rd Grade
10 questions
Appointment Passes Review
Quiz
•
6th - 8th Grade
25 questions
Multiplication Facts
Quiz
•
5th Grade
11 questions
All about me
Quiz
•
Professional Development
22 questions
Adding Integers
Quiz
•
6th Grade
15 questions
Subtracting Integers
Quiz
•
7th Grade
20 questions
Grammar Review
Quiz
•
6th - 9th Grade
Discover more resources for Mathematics
20 questions
Order of Operations
Quiz
•
9th Grade
13 questions
8th - Unit 1 Lesson 3
Quiz
•
9th - 12th Grade
15 questions
Two Step Equations
Quiz
•
9th Grade
16 questions
Segment Addition Postulate
Quiz
•
10th Grade
12 questions
Absolute Value Equations
Quiz
•
9th Grade
7 questions
EAHS PBIS Lesson- Bus
Lesson
•
9th - 12th Grade
21 questions
SOLVING TWO STEP EQUATIONS
Quiz
•
9th Grade
15 questions
Combine Like Terms and Distributive Property
Quiz
•
8th - 9th Grade