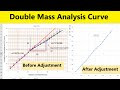
Double Mass Analysis in Hydrology
Interactive Video
•
Mathematics, Science, Geography
•
9th - 10th Grade
•
Practice Problem
•
Hard

Patricia Brown
FREE Resource
Read more
10 questions
Show all answers
1.
MULTIPLE CHOICE QUESTION
30 sec • 1 pt
What is the primary purpose of using double mass analysis in hydrology?
To calculate the average wind speed.
To determine the soil composition.
To check the consistency of rainfall records.
To measure the temperature changes over time.
2.
MULTIPLE CHOICE QUESTION
30 sec • 1 pt
Which of the following is a reason for changes in the hydrological environment of a station?
Removal of a forest.
Installation of solar panels.
Construction of a new road.
Increase in local population.
3.
MULTIPLE CHOICE QUESTION
30 sec • 1 pt
How can you calculate cumulative rainfall for a station using a spreadsheet?
By using the SUM function.
By using the AVERAGE function.
By manually adding each year's rainfall.
By using the equal sign and dragging the formula.
4.
MULTIPLE CHOICE QUESTION
30 sec • 1 pt
What is the purpose of plotting cumulative rainfall data?
To create a colorful chart.
To visually identify changes in rainfall patterns.
To compare temperature variations.
To calculate the total rainfall.
5.
MULTIPLE CHOICE QUESTION
30 sec • 1 pt
Which color is used to format the major grid lines in the graph?
Red
Blue
Green
Black
6.
MULTIPLE CHOICE QUESTION
30 sec • 1 pt
What is the adjustment factor used for in double mass analysis?
To determine the wind speed.
To change the color of the graph.
To calculate the average temperature.
To adjust the rainfall data for consistency.
7.
MULTIPLE CHOICE QUESTION
30 sec • 1 pt
How is the slope of a line calculated in the context of double mass analysis?
By dividing the change in rainfall by the change in time.
By subtracting the initial rainfall from the final rainfall.
By multiplying the rainfall by the time period.
By adding the rainfall values together.
Access all questions and much more by creating a free account
Create resources
Host any resource
Get auto-graded reports
Continue with Google

Continue with Email
Continue with Classlink
Continue with Clever
or continue with
Microsoft
%20(1).png)
Apple
Others
Already have an account?
Popular Resources on Wayground

8 questions
Spartan Way - Classroom Responsible
Quiz
•
9th - 12th Grade
15 questions
Fractions on a Number Line
Quiz
•
3rd Grade
14 questions
Boundaries & Healthy Relationships
Lesson
•
6th - 8th Grade
20 questions
Equivalent Fractions
Quiz
•
3rd Grade
3 questions
Integrity and Your Health
Lesson
•
6th - 8th Grade
25 questions
Multiplication Facts
Quiz
•
5th Grade
9 questions
FOREST Perception
Lesson
•
KG
20 questions
Main Idea and Details
Quiz
•
5th Grade
Discover more resources for Mathematics
20 questions
Graphing Inequalities on a Number Line
Quiz
•
6th - 9th Grade
11 questions
Adding and Subtracting Polynomials
Quiz
•
9th Grade
20 questions
Box and Whisker Plots
Quiz
•
9th Grade
18 questions
Exponential Growth and Decay
Quiz
•
9th Grade
12 questions
Equation of a Circle
Lesson
•
10th Grade
12 questions
Exponential Growth and Decay
Quiz
•
9th Grade
14 questions
Making Inferences From Samples
Quiz
•
7th - 12th Grade
24 questions
Solving Linear Equations with Variables on Both Sides
Quiz
•
9th Grade