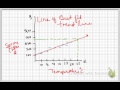
Understanding Lines of Best Fit
Interactive Video
•
Mathematics, Science, Business
•
9th - 10th Grade
•
Practice Problem
•
Hard

Patricia Brown
FREE Resource
Read more
10 questions
Show all answers
1.
MULTIPLE CHOICE QUESTION
30 sec • 1 pt
What is the primary purpose of a line of best fit?
To create a perfect line through the origin
To predict relationships between variables
To eliminate outliers from data
To connect all data points exactly
2.
MULTIPLE CHOICE QUESTION
30 sec • 1 pt
When drawing a line of best fit, what is a common approach to dividing the data?
Drawing the line parallel to the x-axis
Dividing the data into two equal sections
Aligning the line with the y-axis
Ensuring the line passes through the first and last points
3.
MULTIPLE CHOICE QUESTION
30 sec • 1 pt
What is the first step in drawing a line of best fit?
Changing the color of the line
Calculating the slope of the line
Choosing a random starting point
Separating the data into two sections
4.
MULTIPLE CHOICE QUESTION
30 sec • 1 pt
How can the line of best fit be used in practical scenarios?
To predict future values based on existing data
To determine the exact value of each data point
To remove errors from the data set
To calculate the average of all data points
5.
MULTIPLE CHOICE QUESTION
30 sec • 1 pt
What can be predicted using a line of best fit in the context of the video?
The exact temperature on a given day
The number of data points in a scatter plot
The average temperature over a month
The sales of clothes based on temperature
6.
MULTIPLE CHOICE QUESTION
30 sec • 1 pt
What is a potential outcome when different people draw lines of best fit on the same graph?
The lines will be parallel
The lines will always intersect at the same point
Each person may draw a slightly different line
All lines will be identical
7.
MULTIPLE CHOICE QUESTION
30 sec • 1 pt
What is a common challenge when using a line of best fit for predictions?
Calculating the exact midpoint of the data
Ensuring the line is perfectly straight
Predicting values outside the range of data
Aligning the line with the x-axis
Access all questions and much more by creating a free account
Create resources
Host any resource
Get auto-graded reports
Continue with Google

Continue with Email
Continue with Classlink
Continue with Clever
or continue with
Microsoft
%20(1).png)
Apple
Others
Already have an account?
