Ecological Evaluation and Spider Graphs
Interactive Video
•
Biology, Science, Environmental Science
•
9th - 10th Grade
•
Practice Problem
•
Hard

Patricia Brown
FREE Resource
Read more
10 questions
Show all answers
1.
MULTIPLE CHOICE QUESTION
30 sec • 1 pt
What is the primary purpose of creating a spider graph in ecological evaluation?
To identify animal species
To compare ecological conditions
To calculate soil pH levels
To measure the height of trees
2.
MULTIPLE CHOICE QUESTION
30 sec • 1 pt
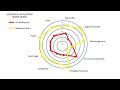
Why are there six circles in the spider graph?
To represent six different ecosystems
To indicate six levels of soil moisture
To correspond to six possible values of categories
To show six stages of plant growth
3.
MULTIPLE CHOICE QUESTION
30 sec • 1 pt
Which category is NOT part of the nine analyzed in the ecological evaluation?
Water salinity
Apparent density
Economic productivity
Soil profile
4.
MULTIPLE CHOICE QUESTION
30 sec • 1 pt
What should you do after marking all the points for the analog forestry site?
Erase the points
Join them with a colored line
Add more categories
Remove the outer circle
5.
MULTIPLE CHOICE QUESTION
30 sec • 1 pt
When plotting values for the reference mature forest, what is used to differentiate it from the analog site?
A different type of paper
A different number of circles
A different colored marker
A different shape of polygon
6.
MULTIPLE CHOICE QUESTION
30 sec • 1 pt
What do the two polygons in the spider graph represent?
Two different weather conditions
Two different types of soil
Ecological conditions of the analog site and reference forest
Two different species of trees
7.
MULTIPLE CHOICE QUESTION
30 sec • 1 pt
What might a point closer to the center of the spider graph indicate?
Higher ecological value
Lower ecological value
More biodiversity
Less biodiversity
Access all questions and much more by creating a free account
Create resources
Host any resource
Get auto-graded reports
Continue with Google

Continue with Email
Continue with Classlink
Continue with Clever
or continue with
Microsoft
%20(1).png)
Apple
Others
Already have an account?
