Mitosis and Chromatid Distances
Interactive Video
•
Biology, Science, Chemistry
•
9th - 12th Grade
•
Practice Problem
•
Hard

Patricia Brown
FREE Resource
Read more
10 questions
Show all answers
1.
MULTIPLE CHOICE QUESTION
30 sec • 1 pt
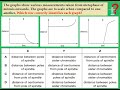
What is the primary purpose of the graph discussed in the video?
To compare mitosis with meiosis
To calculate the duration of mitosis
To measure the speed of cell division
To identify different parts of mitosis
2.
MULTIPLE CHOICE QUESTION
30 sec • 1 pt
What does Graph X represent in the context of mitosis?
Distance between chromosomes
Distance of centromeres from spindle poles
Distance between sister chromatids
Distance between spindle poles
3.
MULTIPLE CHOICE QUESTION
30 sec • 1 pt
How does the distance represented by Graph X change after metaphase?
It fluctuates randomly
It decreases to zero
It increases to a maximum
It remains constant
4.
MULTIPLE CHOICE QUESTION
30 sec • 1 pt
What does Graph Y illustrate about the spindle poles during mitosis?
They remain stationary
They move closer together
They disappear
They move apart slightly during cytokinesis
5.
MULTIPLE CHOICE QUESTION
30 sec • 1 pt
During which phase does the distance between spindle poles increase slightly?
Prophase
Cytokinesis
Metaphase
Anaphase
6.
MULTIPLE CHOICE QUESTION
30 sec • 1 pt
What does Graph Z show about the sister chromatids during anaphase?
They move apart, increasing the distance
They remain at zero distance
They move closer together
They disappear
7.
MULTIPLE CHOICE QUESTION
30 sec • 1 pt
At what point does the distance between sister chromatids start to increase?
Telophase
Anaphase
Metaphase
Prophase
Access all questions and much more by creating a free account
Create resources
Host any resource
Get auto-graded reports
Continue with Google

Continue with Email
Continue with Classlink
Continue with Clever
or continue with
Microsoft
%20(1).png)
Apple
Others
Already have an account?
