Analyzing Speed and Distance Graphs
Interactive Video
•
Mathematics, Science, Physics
•
9th - 10th Grade
•
Practice Problem
•
Hard

Thomas White
FREE Resource
Read more
10 questions
Show all answers
1.
MULTIPLE CHOICE QUESTION
30 sec • 1 pt
What is the primary purpose of using graphs in this lesson?
To calculate exact values
To describe relationships between quantities
To memorize data
To replace verbal descriptions
2.
MULTIPLE CHOICE QUESTION
30 sec • 1 pt
In a distance versus time graph, what does a horizontal line indicate?
Increasing distance
Variable distance
Decreasing distance
Constant distance
3.
MULTIPLE CHOICE QUESTION
30 sec • 1 pt
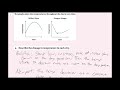
How does the temperature change in Belfast, Maine, throughout the day?
Remains constant
Starts high and decreases
Starts low and increases, then decreases
Fluctuates randomly
4.
MULTIPLE CHOICE QUESTION
30 sec • 1 pt
What could be a possible explanation for the temperature pattern in Newport, Oregon?
A malfunctioning thermometer
A constant sunny day
A storm causing cooling and then warming
A sudden heatwave
5.
MULTIPLE CHOICE QUESTION
30 sec • 1 pt
What is the initial speed of the subway train in the example?
Constant speed
Variable speed
Zero speed
Maximum speed
6.
MULTIPLE CHOICE QUESTION
30 sec • 1 pt
How does the subway train's speed change after reaching maximum speed?
It fluctuates
It stops abruptly
It remains constant for a while
It decreases immediately
7.
MULTIPLE CHOICE QUESTION
30 sec • 1 pt
What is the initial pace of Runner A in the race example?
Slower than Runner B
Variable pace
Same as Runner B
Faster than Runner B
Access all questions and much more by creating a free account
Create resources
Host any resource
Get auto-graded reports
Continue with Google

Continue with Email
Continue with Classlink
Continue with Clever
or continue with
Microsoft
%20(1).png)
Apple
Others
Already have an account?
