- Resource Library
- Math
- Probability And Statistics
- Relative Frequency
- Relative Frequency And Data Representation
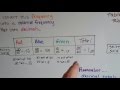
Relative Frequency and Data Representation
Interactive Video
•
Mathematics
•
8th Grade
•
Practice Problem
•
Hard

Thomas White
FREE Resource
Read more
10 questions
Show all answers
1.
MULTIPLE CHOICE QUESTION
30 sec • 1 pt
What is the primary purpose of a relative frequency table?
To calculate the average of all data points
To list all possible outcomes
To show the proportion of each category relative to the total
To display data in alphabetical order
2.
MULTIPLE CHOICE QUESTION
30 sec • 1 pt
If Talos sold 20 red shirts out of a total of 60, what is the relative frequency in decimal form?
0.17
0.20
0.50
0.33
3.
MULTIPLE CHOICE QUESTION
30 sec • 1 pt
How do you represent a repeating decimal in a relative frequency table?
By converting it to a fraction
By rounding it to the nearest whole number
By using a bar over the repeating digit
By ignoring the repeating part
4.
MULTIPLE CHOICE QUESTION
30 sec • 1 pt
What is the percentage equivalent of a relative frequency of 0.50?
75%
50%
25%
100%
5.
MULTIPLE CHOICE QUESTION
30 sec • 1 pt
When converting decimals to percentages, what should the total percentage be?
150%
100%
50%
75%
6.
MULTIPLE CHOICE QUESTION
30 sec • 1 pt
What is the relative frequency of 10 green shirts sold out of 60 in percentage form?
17%
20%
16.67%
10%
7.
MULTIPLE CHOICE QUESTION
30 sec • 1 pt
Why is it important for the total of a relative frequency table to equal 1.00?
To simplify the table
To match the total number of items
To make calculations easier
To ensure all data is accounted for
Access all questions and much more by creating a free account
Create resources
Host any resource
Get auto-graded reports
Continue with Google

Continue with Email
Continue with Microsoft
or continue with

%20(1).png)
Apple
Others
Already have an account?
